Key takeaways
- ChatGPT holds 57.5% of worldwide AI chatbot web-visit share in September 2026, up from a low of 53.7% in May. Its share has risen every month since May after falling from 79.0% in May 2025.
- Google Gemini is second at 25.7% worldwide share with 2.64 billion web visits in September 2026. Its share has fallen for three months from a June peak of 28.6%, and its visits are 9% below May.
- Claude passed 1 billion monthly web visits for the first time in September 2026 (1.01 billion, 9.8% share), up 545% year over year. In early October, Claude's visits ran 17.6% above the same weekdays in September, the only large gain in the set.
- The seven assistants drew 10.29 billion combined web visits in September 2026, up 30% year over year but within the 9.8 billion to 10.4 billion range they have held every month since March 2026, so share now moves between assistants more than the total grows.
- In the United States, ChatGPT holds 63.5% web-visit share in September 2026, up 1.9 points in a month, while Gemini holds 17.4% and Claude 13.2%.
- Perplexity (0.9%) and Microsoft Copilot (0.6%) recorded their lowest web-visit shares of the past 15 months. Copilot's US traffic from March to June 2026 came with a 66% to 69% bounce rate and fell back in July.
- ChatGPT leads in 16 of the 18 countries this report breaks out beyond the US. Gemini leads in Italy (44.8% to 43.5%), and DeepSeek leads among these seven assistants in China (73.2%) and holds 32.1% in Russia.
- Every flagship model released in September 2026 (GPT-6, Claude Opus 5.5, Gemini 4 Argon, Grok 4.7) launched without GPQA Diamond or SWE-bench Verified scores, and flagship output prices fell or held: GPT-6 Sol lists at $10 per million output tokens against GPT-5.5's $30.
Which AI chatbot has the largest market share in October 2026?
ChatGPT has the largest AI chatbot market share in the October 2026 edition, at 57.5% of worldwide web visits among the seven largest generative AI chatbots in September 2026, the latest complete month of data. The seven assistants drew 10.29 billion combined web visits that month. ChatGPT and Google Gemini together hold 83.2% of those visits, and the other five assistants split the remaining 16.8%.

Source: Similarweb, total (desktop and mobile web) visits, worldwide, September 2026. Shares are each assistant's visits as a percentage of the seven assistants' combined visits and may not sum to 100% because of rounding. MoM compares August 2026; YoY compares September 2025.
Which apps are counted, and which are not
The ranking covers standalone, general-purpose generative AI assistants on a separable primary web domain above roughly 50 million monthly web visits. It excludes assistants with no separable domain such as Meta AI inside Meta's apps, companion and character apps such as Character.AI, answer aggregators such as Poe, and major Chinese-language assistants such as Doubao, Ernie, and Qwen. Adding any of these would lower every share figure, most visibly at positions 4 to 7. Read the lower positions as shares of these seven assistants, not of all AI chatbot usage worldwide. Microsoft Copilot fell to 64.4 million web visits in September 2026, still above the 50 million inclusion line.
What changed in AI chatbot usage in September 2026?
September 2026 lifted ChatGPT and Claude and left the smaller assistants lower. ChatGPT's worldwide web visits rose 5% from August to 5.92 billion, and Claude's rose 7% to 1.01 billion, its first month above 1 billion. Gemini and DeepSeek each added about 1%. Grok fell 2%, Perplexity 4%, and Microsoft Copilot 12%.
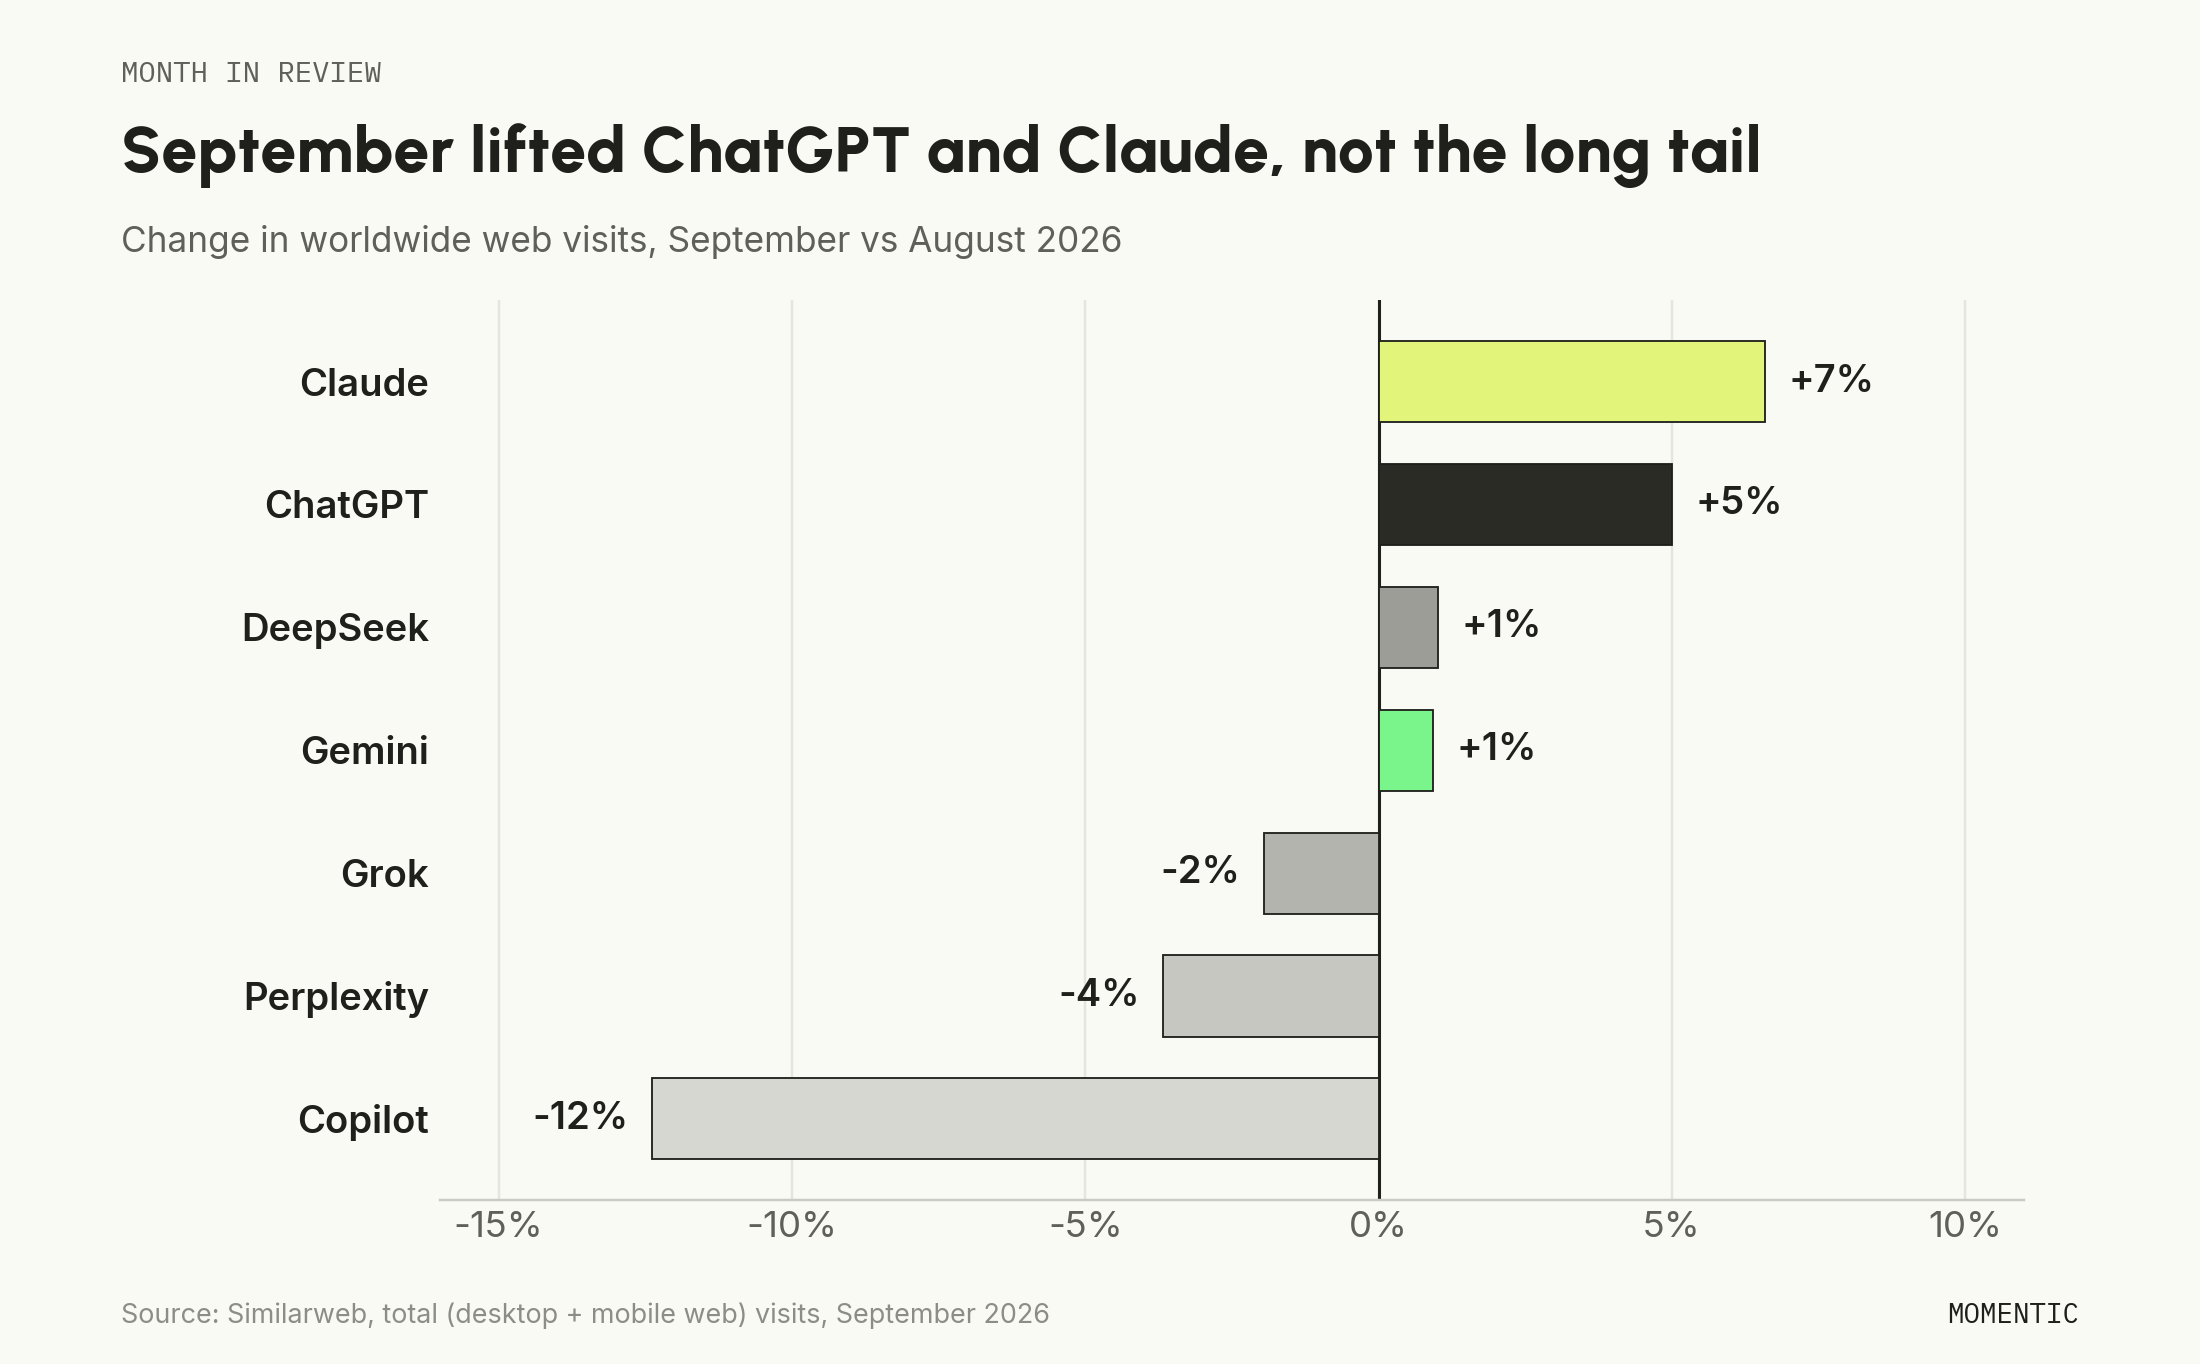
The September gains concentrate in the United States, where ChatGPT's web visits rose 14% in one month to 1.16 billion. ChatGPT's US visits rose 12% in the same August-to-September window in 2025, so part of the jump repeats a back-to-school pattern. OpenAI made GPT-6 Astra generally available in ChatGPT on September 8, 2026, which coincides with the month's gain, though the data cannot separate the two effects.
What is the AI chatbot market share in the United States?
In the United States, ChatGPT holds 63.5% of AI chatbot web-visit share in September 2026, ahead of Google Gemini (17.4%) and Claude (13.2%). The US market is more concentrated at the top than the worldwide market and has moved toward ChatGPT for three straight months: its US share was 58.2% in June 2026. Gemini's US share is lower than its worldwide share because its largest markets outside the US are in Asia and Latin America, and Claude's US share is higher because 23.7% of Claude's visits come from the US, the second-highest concentration among the seven.
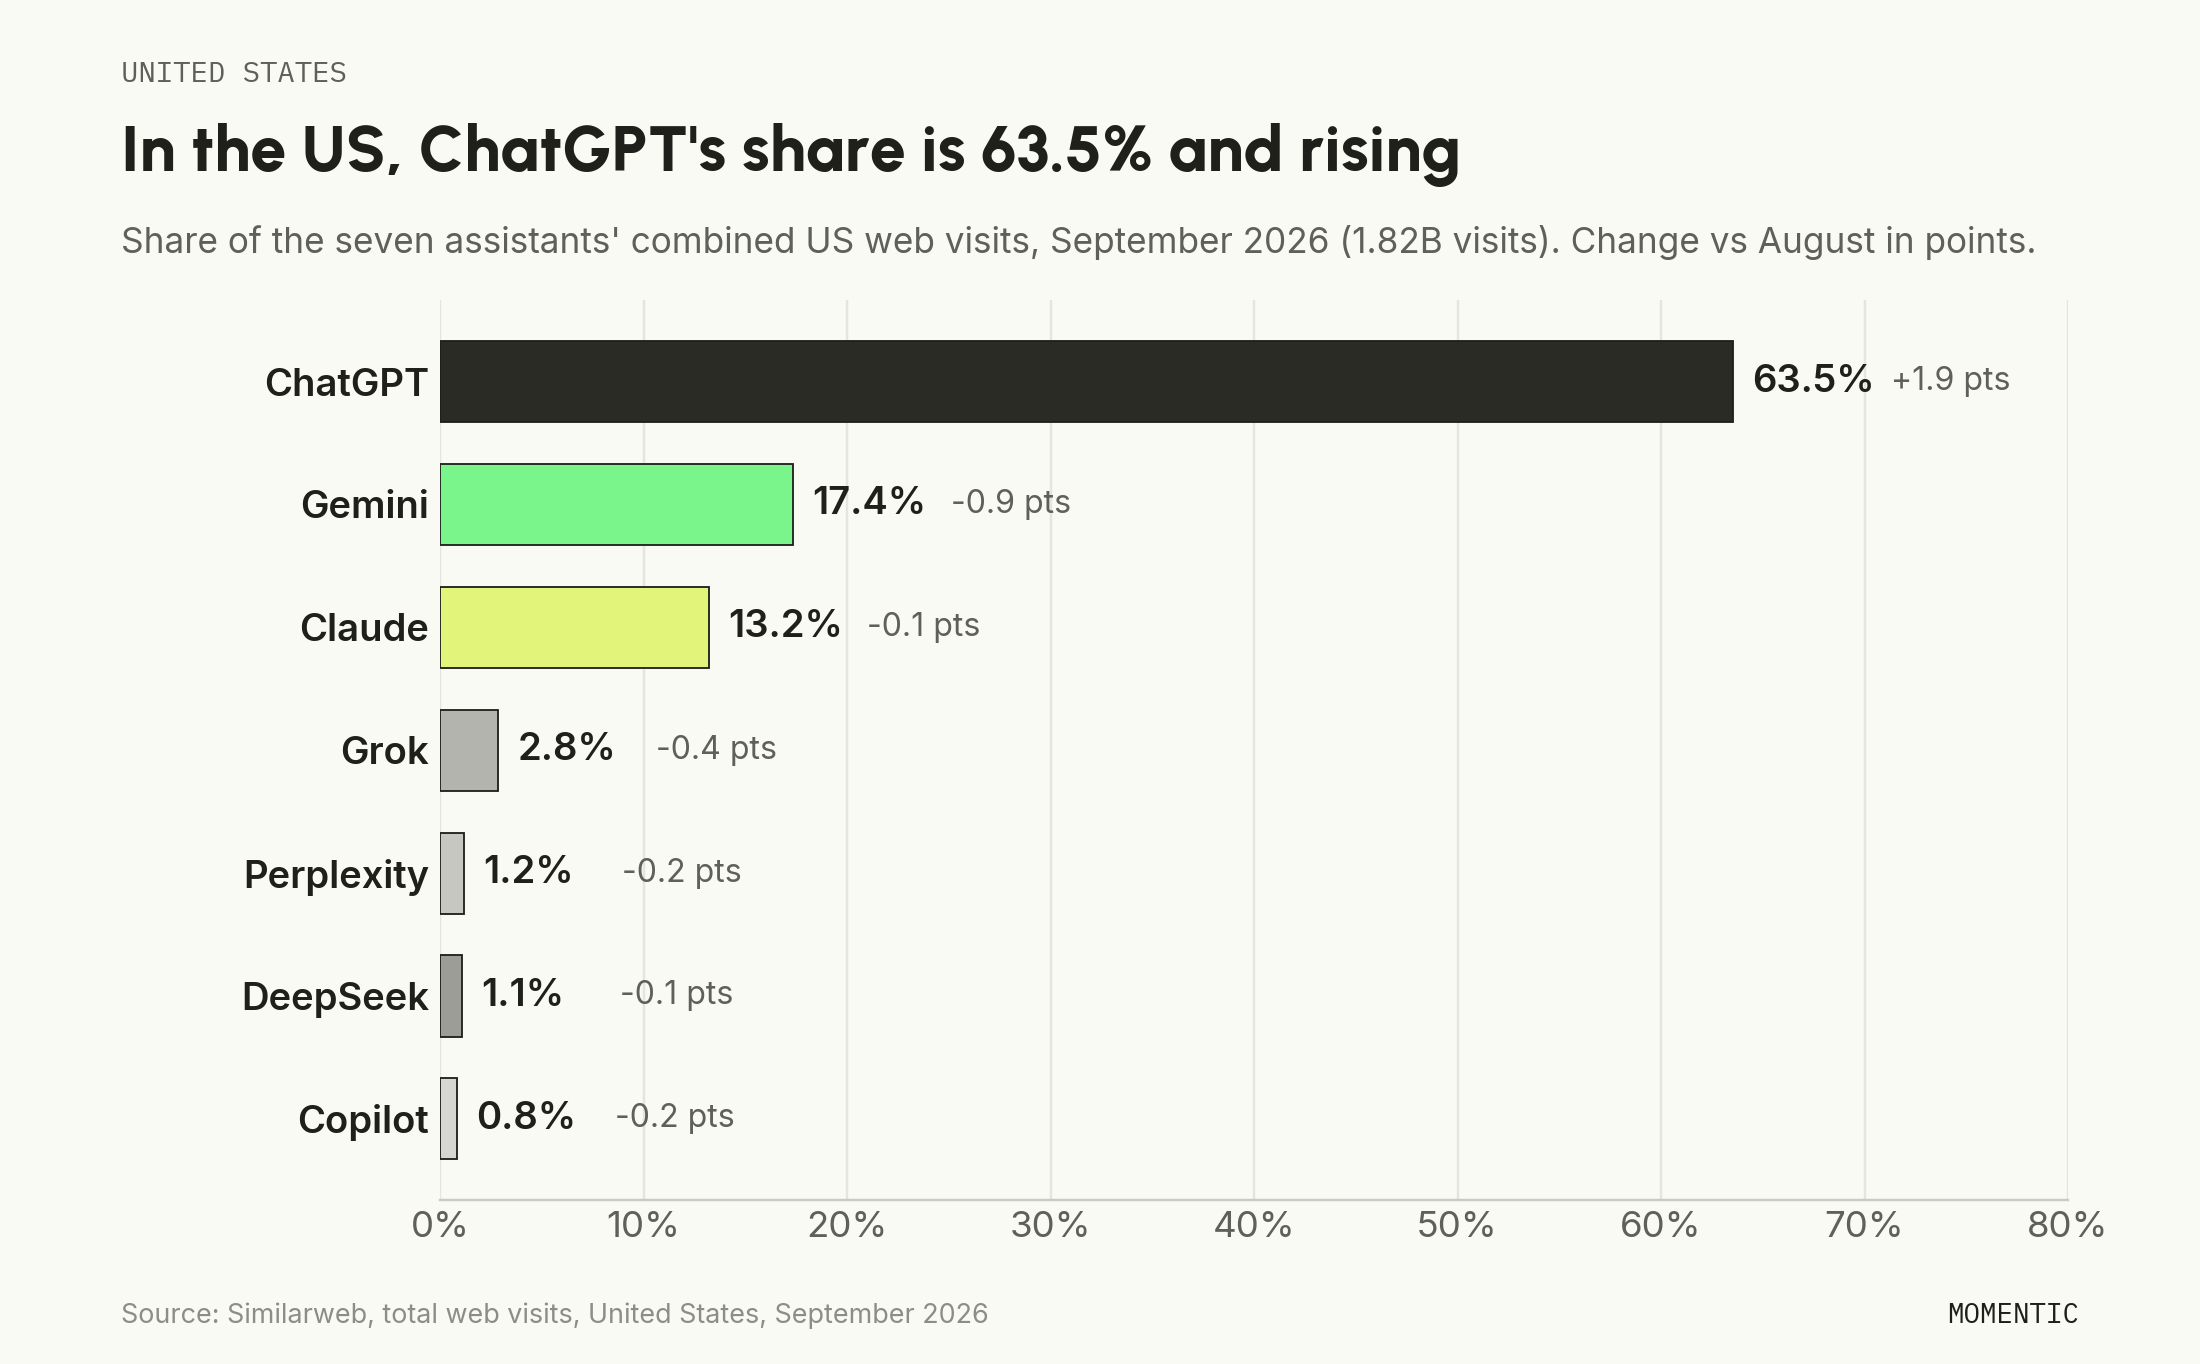
Source: Similarweb, total web visits, United States, September 2026. US quarterly growth compares June 2026; US YoY compares September 2025. Shares may not sum to 100% because of rounding.
The seven assistants drew 1.82 billion combined US web visits in September 2026, up 42% year over year, faster than the 30% worldwide growth.
How has AI chatbot market share changed over time?
AI chatbot web-visit share moved from ChatGPT to Gemini and Claude for most of the past 19 months, then partly reversed after May 2026. ChatGPT's share of the seven assistants' combined visits fell from 76.5% in February 2025 to a low of 53.7% in May 2026 and recovered to 57.5% by September 2026. Gemini's share rose from 5.6% to a peak of 28.6% in June 2026 and has since eased to 25.7%. Claude's share rose from 1.4% to 9.8% and has held between 9.2% and 9.8% since May.
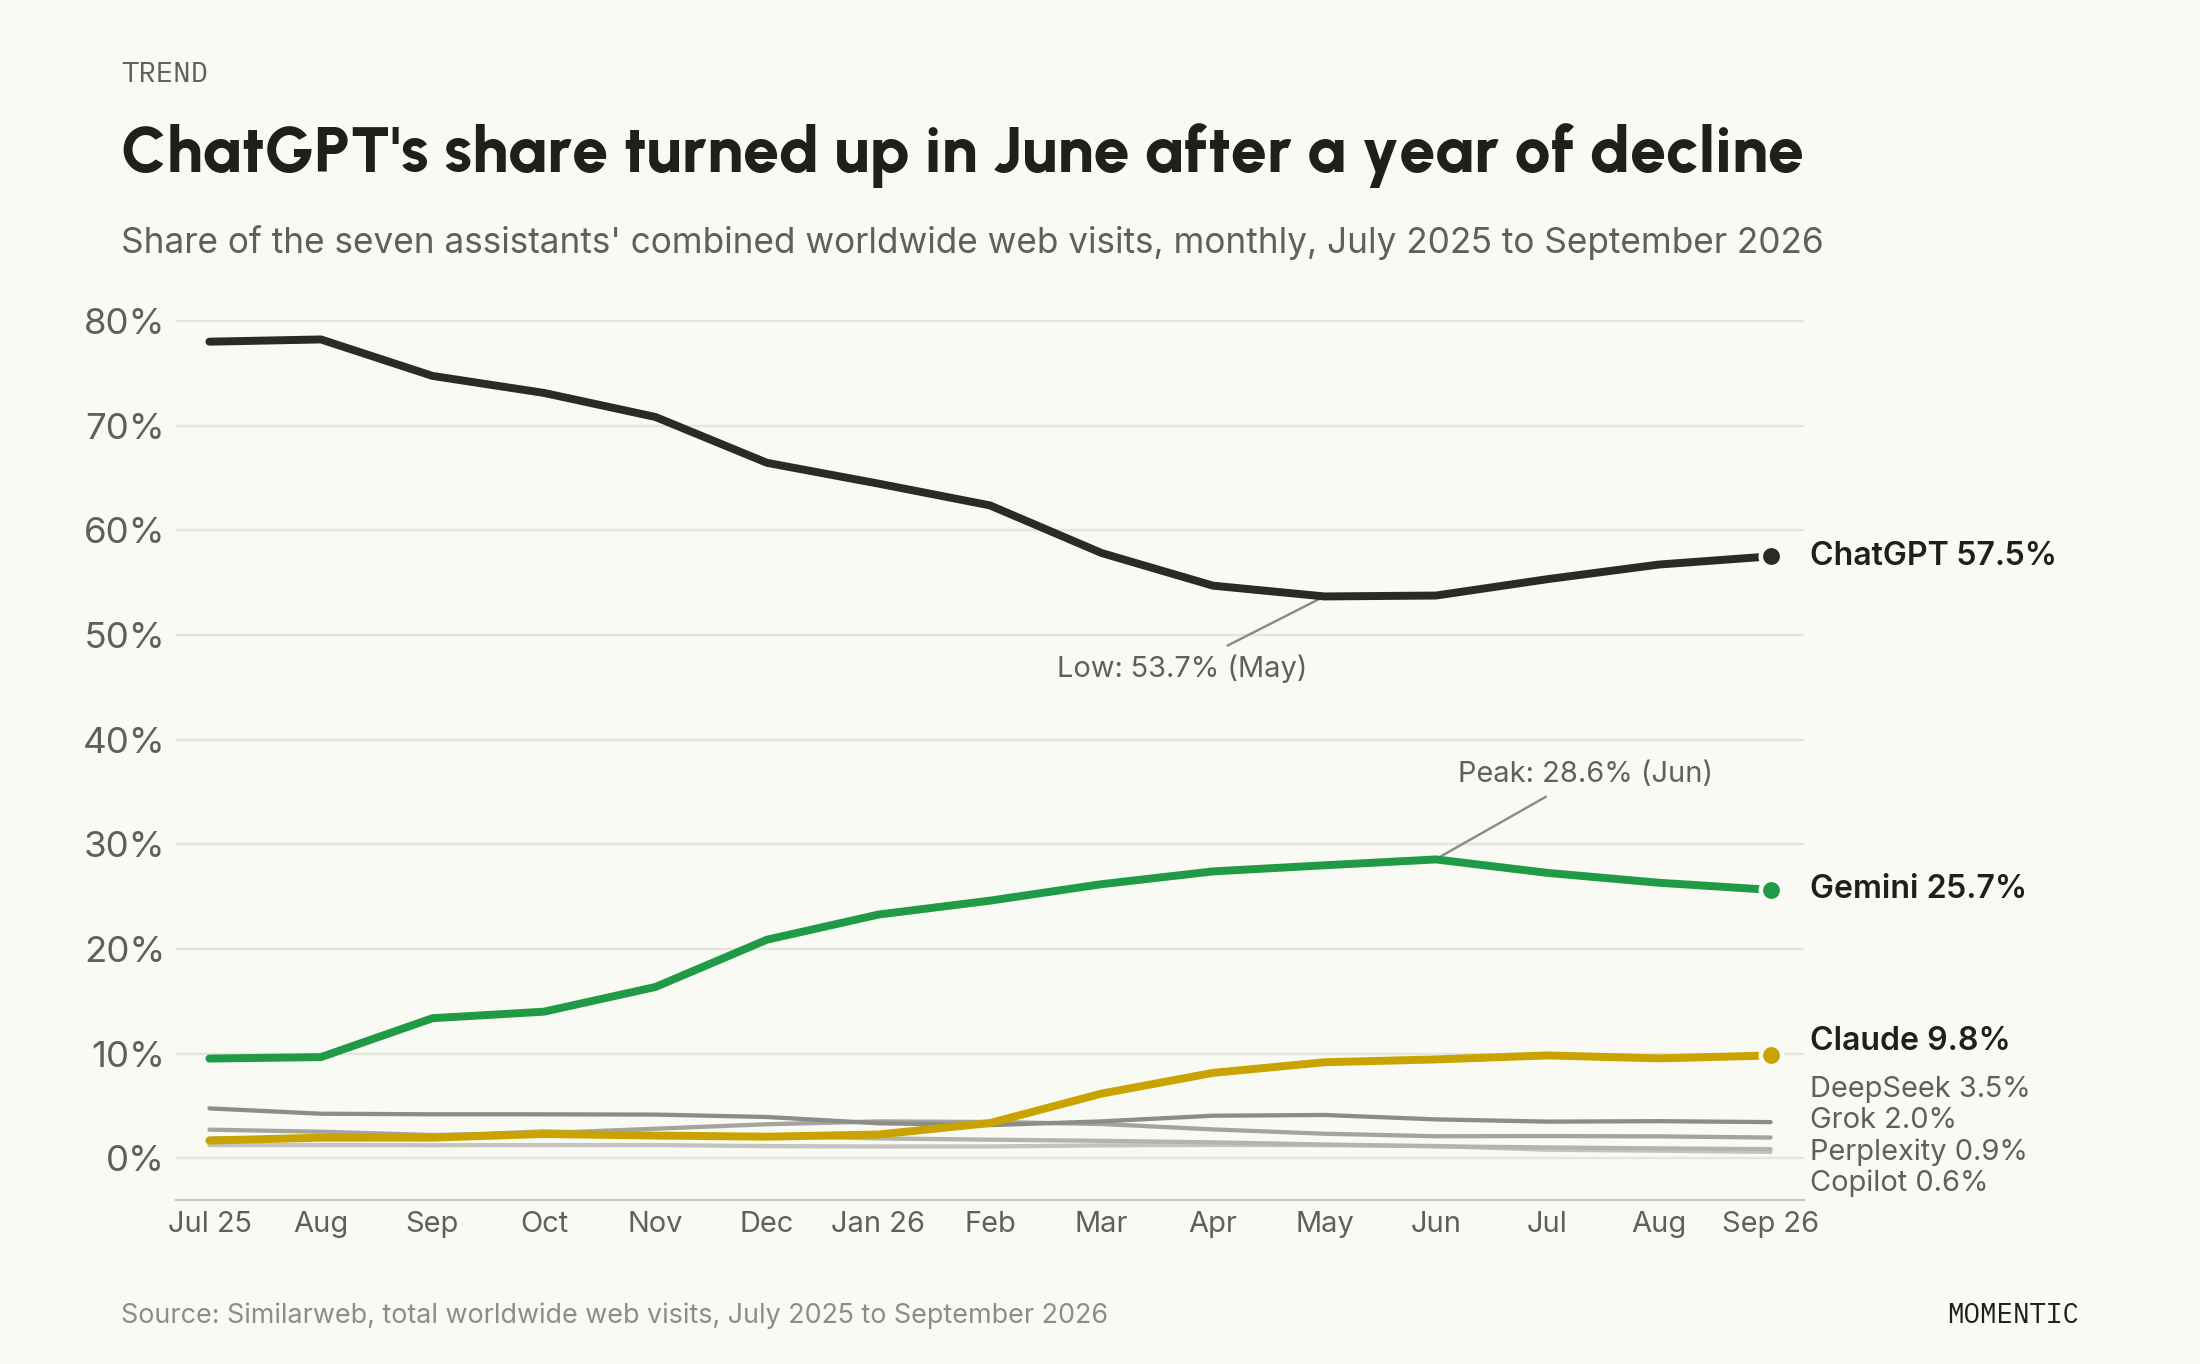
Source: Similarweb, total worldwide web visits; each assistant's share of the seven assistants' combined visits at each month. February and May 2025 columns are carried from earlier editions of this report. Columns may not sum to 100% because of rounding.
ChatGPT held 78% to 79% through August 2025, lost about 24.5 points over the next nine months as Gemini and Claude scaled, and regained about 4 points from June to September 2026. Gemini's climb was steady from September 2025 to June 2026 and then stopped, with three consecutive monthly share declines. Claude's largest move came in a single month: its visits rose 111% from February to March 2026, from 290 million to 614 million, and its share has been close to flat since May. DeepSeek's February 2025 figure (12.1%) reflects its launch spike, and it has held between 3.2% and 4.3% since August 2025.
Is the AI chatbot market still growing?
The AI chatbot market is still larger than a year ago but has stopped growing month to month. The seven assistants drew 10.29 billion combined web visits in September 2026, up 30% from 7.90 billion in September 2025. Every month since March 2026 has landed between 9.8 billion and 10.4 billion, and the highest month on record in this data is May 2026 at 10.37 billion.

A flat total changes how share moves. From mid-2025 to spring 2026, ChatGPT could hold its visit count and still lose share because the total kept growing around it. Since March, one assistant's gain comes from another's visits. Between May and September 2026, ChatGPT added 355 million monthly visits and Claude added 60 million, while Gemini lost 262 million, DeepSeek 73 million, Perplexity 46 million, Grok 39 million, and Copilot 67 million.
How do ChatGPT, Gemini, and Claude compare?
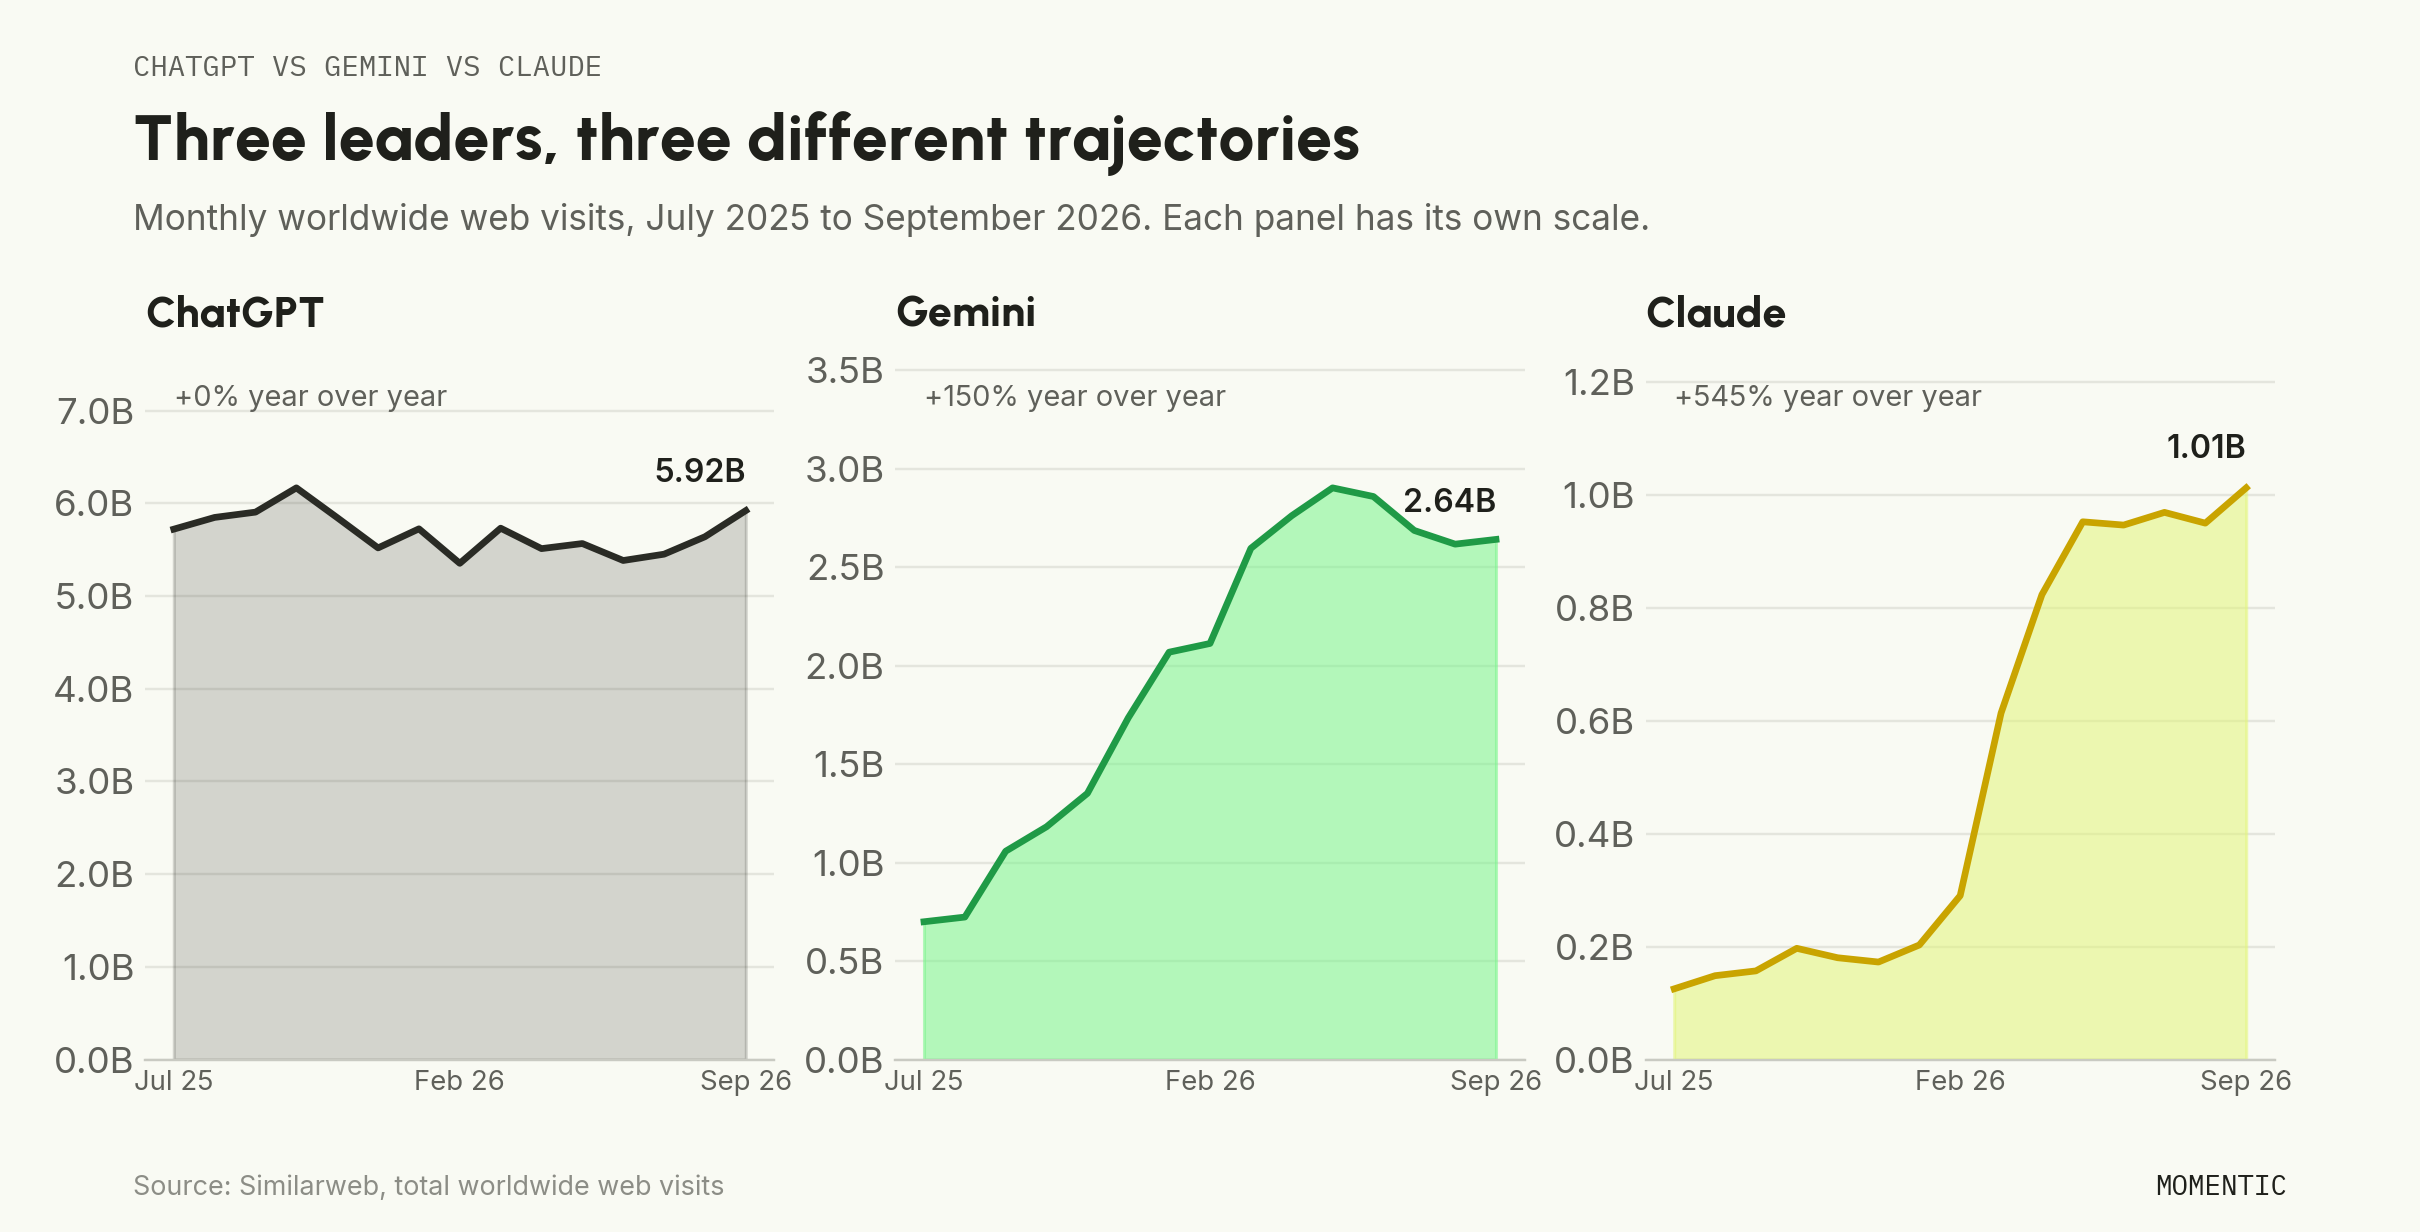
ChatGPT, Gemini, and Claude are the three largest AI chatbots by web traffic, and in September 2026 each is on a different path. ChatGPT is the largest and growing again after a flat year. Gemini is second and has given back some ground since its June peak. Claude is third, crossed 1 billion monthly visits, and posted the largest early-October gain.
Source: Similarweb, total web, September 2026. Company-reported users from OpenAI's DevDay 2026 recap and Alphabet's Q2 2026 earnings remarks; these are self-reported, include apps, and use different definitions.
Is ChatGPT gaining or losing market share?
ChatGPT is gaining web-visit share again. Its worldwide share rose from 53.7% in May 2026 to 57.5% in September 2026, and it has risen every month since May, after falling from 79.0% in May 2025. Its visit count barely moved in either direction: ChatGPT's monthly worldwide web visits stayed between 5.35 billion and 6.17 billion in each of the 15 months from July 2025 to September 2026, and September 2026 (5.92 billion) is level with September 2025 (5.90 billion). The share loss through May came from rivals growing around a flat ChatGPT, and the share recovery since May comes from those rivals shrinking while ChatGPT edged up 6%.
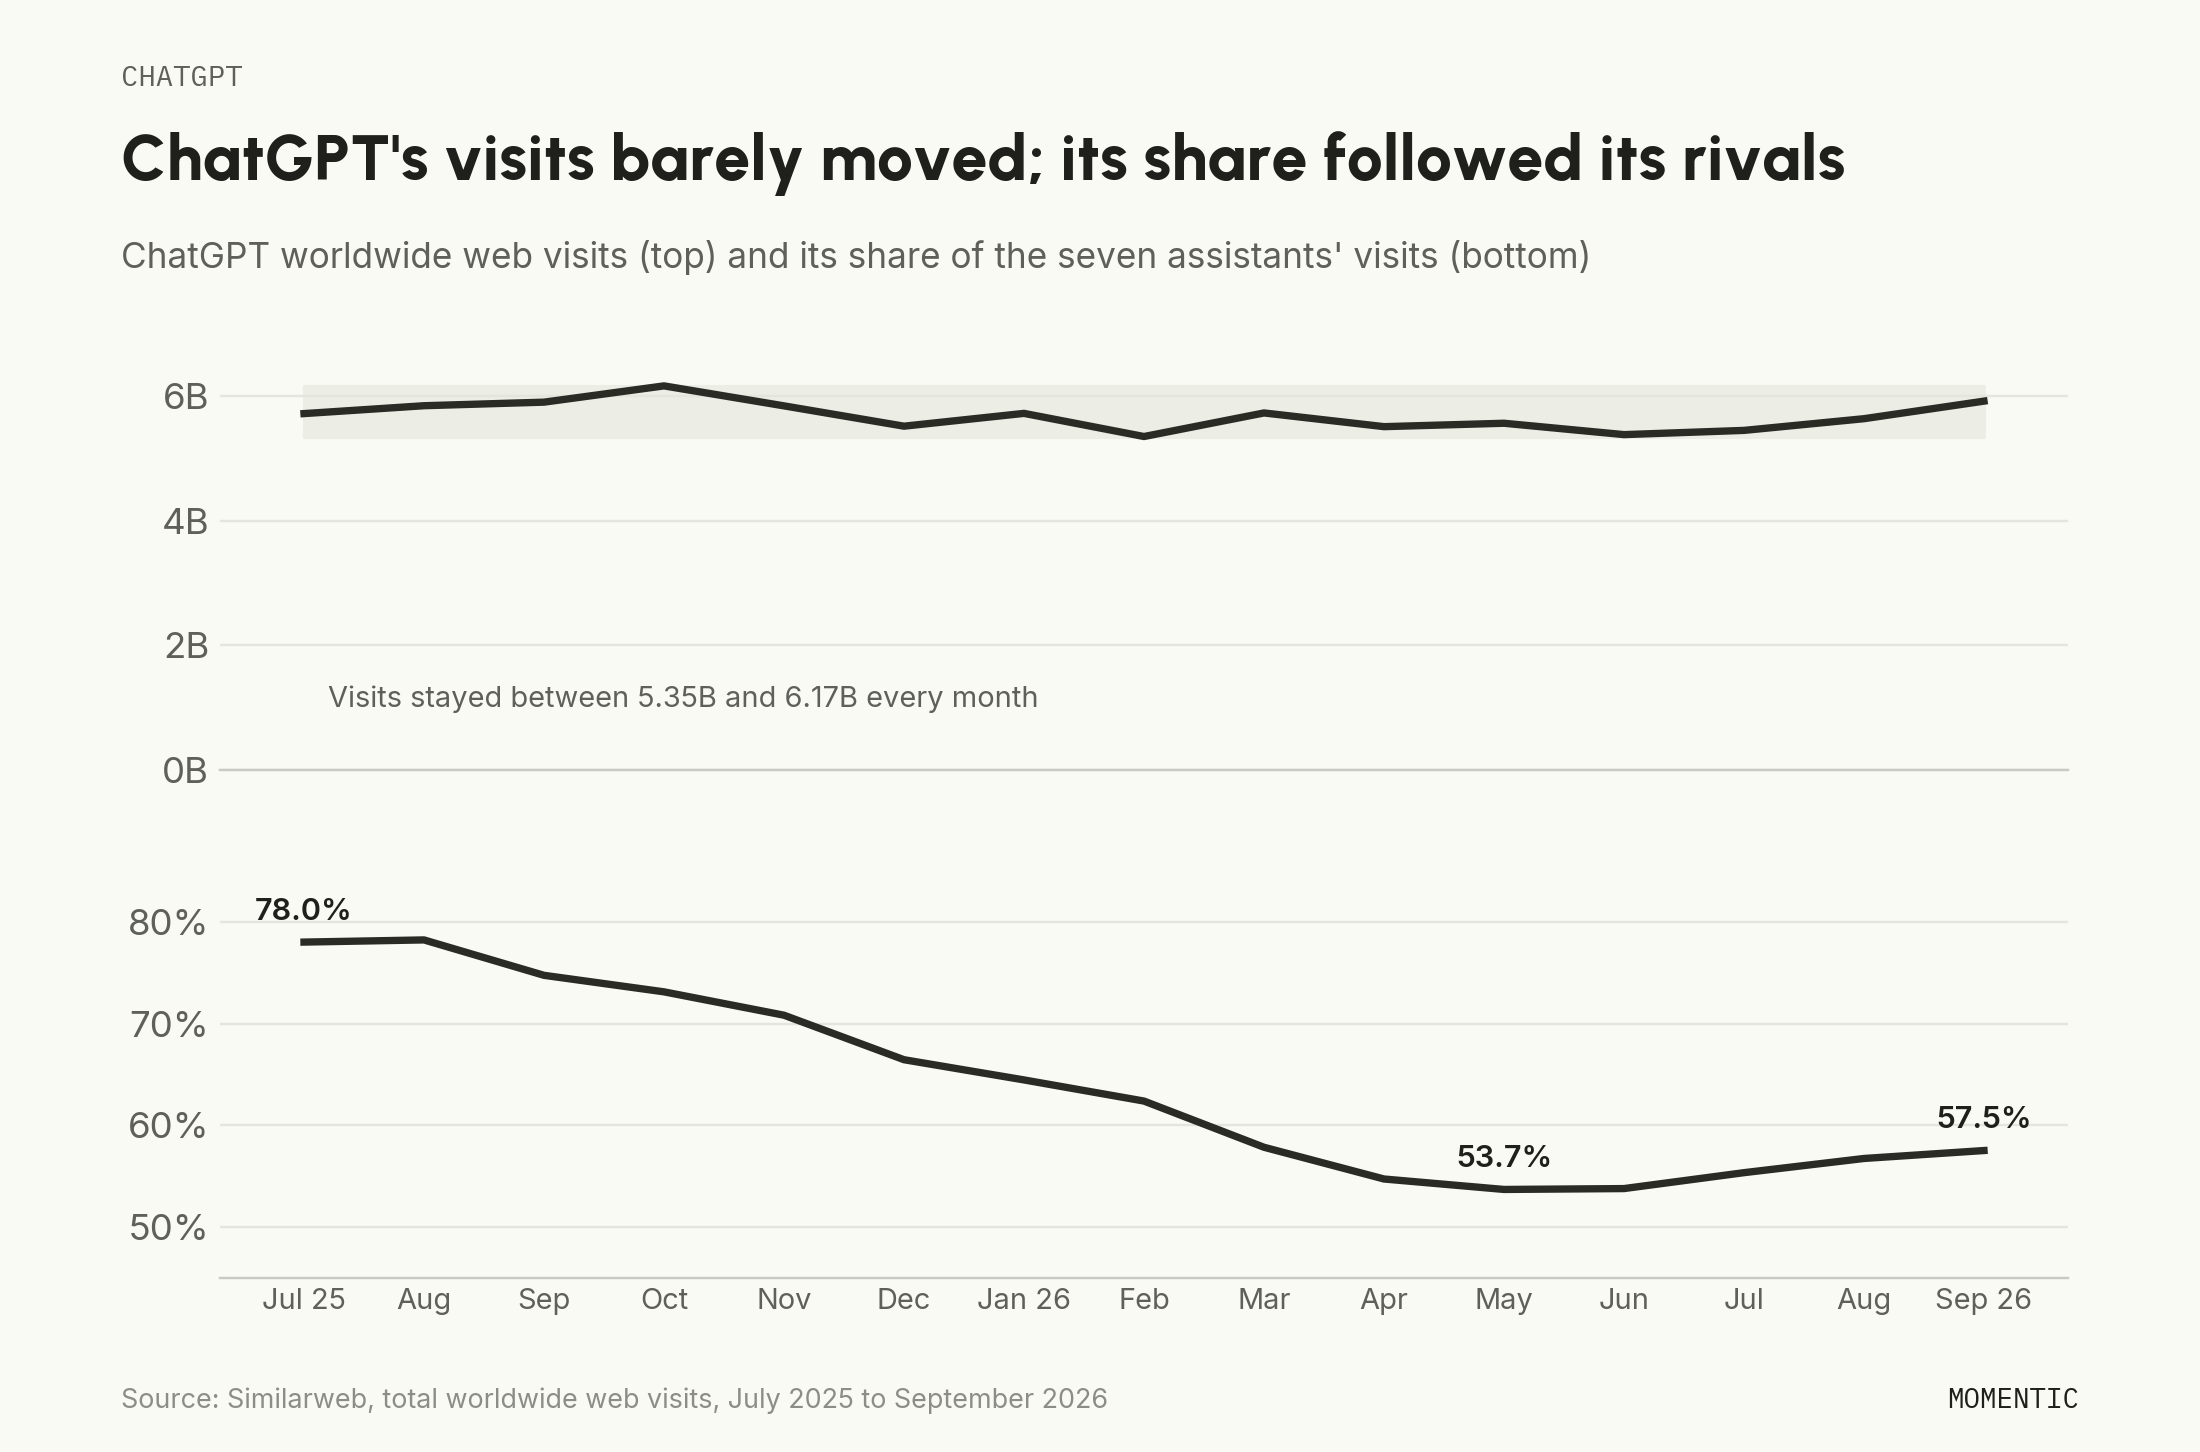
ChatGPT's engagement also moved. Its worldwide bounce rate fell from 33.5% in April 2026 to 24.9% in September, now the lowest of the seven assistants, and pages per visit rose from 3.6 to 4.8. ChatGPT still serves more web visits than the other six assistants combined.
Is Google Gemini overtaking ChatGPT?
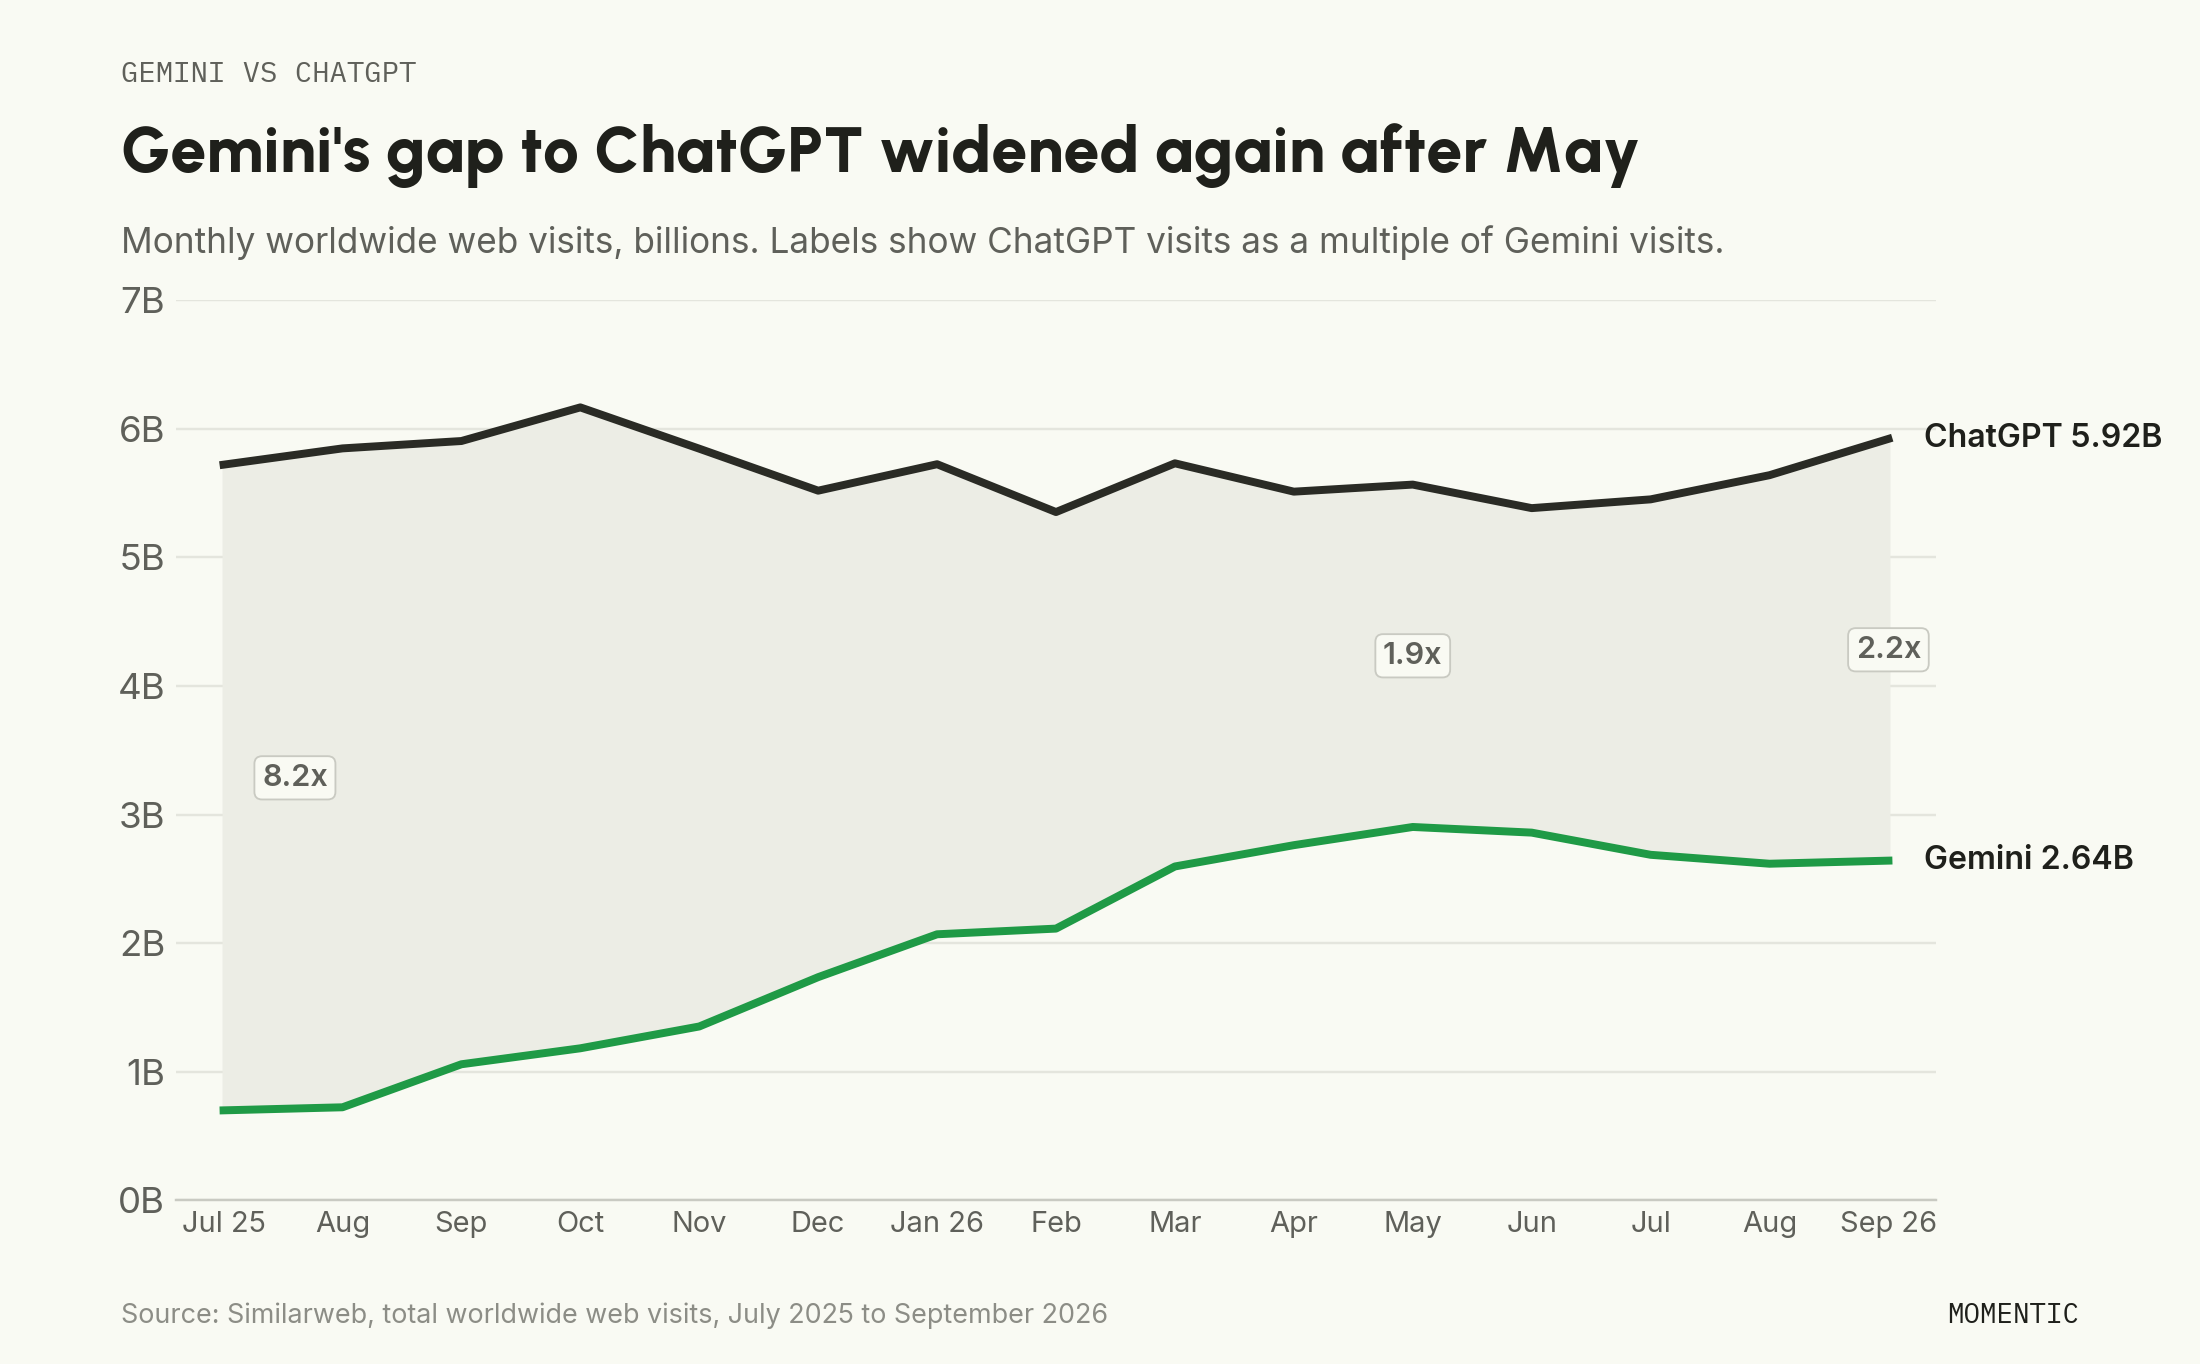
Google Gemini is not overtaking ChatGPT on the web, and the gap widened after May 2026. Gemini drew 2.64 billion worldwide web visits in September 2026 against ChatGPT's 5.92 billion, so ChatGPT's web traffic is 2.2 times Gemini's, up from 1.9 times in May. Gemini's visits peaked at 2.90 billion in May 2026 and are 9% lower four months later, and its share fell from 28.6% in June to 25.7% in September.
Web visits understate Gemini more than most assistants. Alphabet reported 950 million monthly active users for the Gemini app on July 22, 2026, and much of Gemini's use runs through the Android app, the Google app, and Workspace, which web-visit data does not capture. Some of Gemini's measured web visits also arrive from Google entry points, which can raise or lower its share as Google changes those entry points. Gemini leads ChatGPT outright among these seven assistants in one large country, Italy, and comes within 4 points in Vietnam and within 6 points in Turkey (country table below). Google released Gemini 4 Argon on September 30, 2026, with initial access limited to a Google program for trusted cybersecurity defenders, so any effect would appear in later months.
How fast is Claude growing in 2026?
Claude is the fastest-growing major AI chatbot by web visits over the past year, up 545% from 157 million worldwide web visits in September 2025 to 1.01 billion in September 2026. September 2026 is the first month Claude passed 1 billion web visits. Most of that growth came in a short window: Claude's visits rose from 290 million in February 2026 to 953 million in May, and have grown 6% since May.
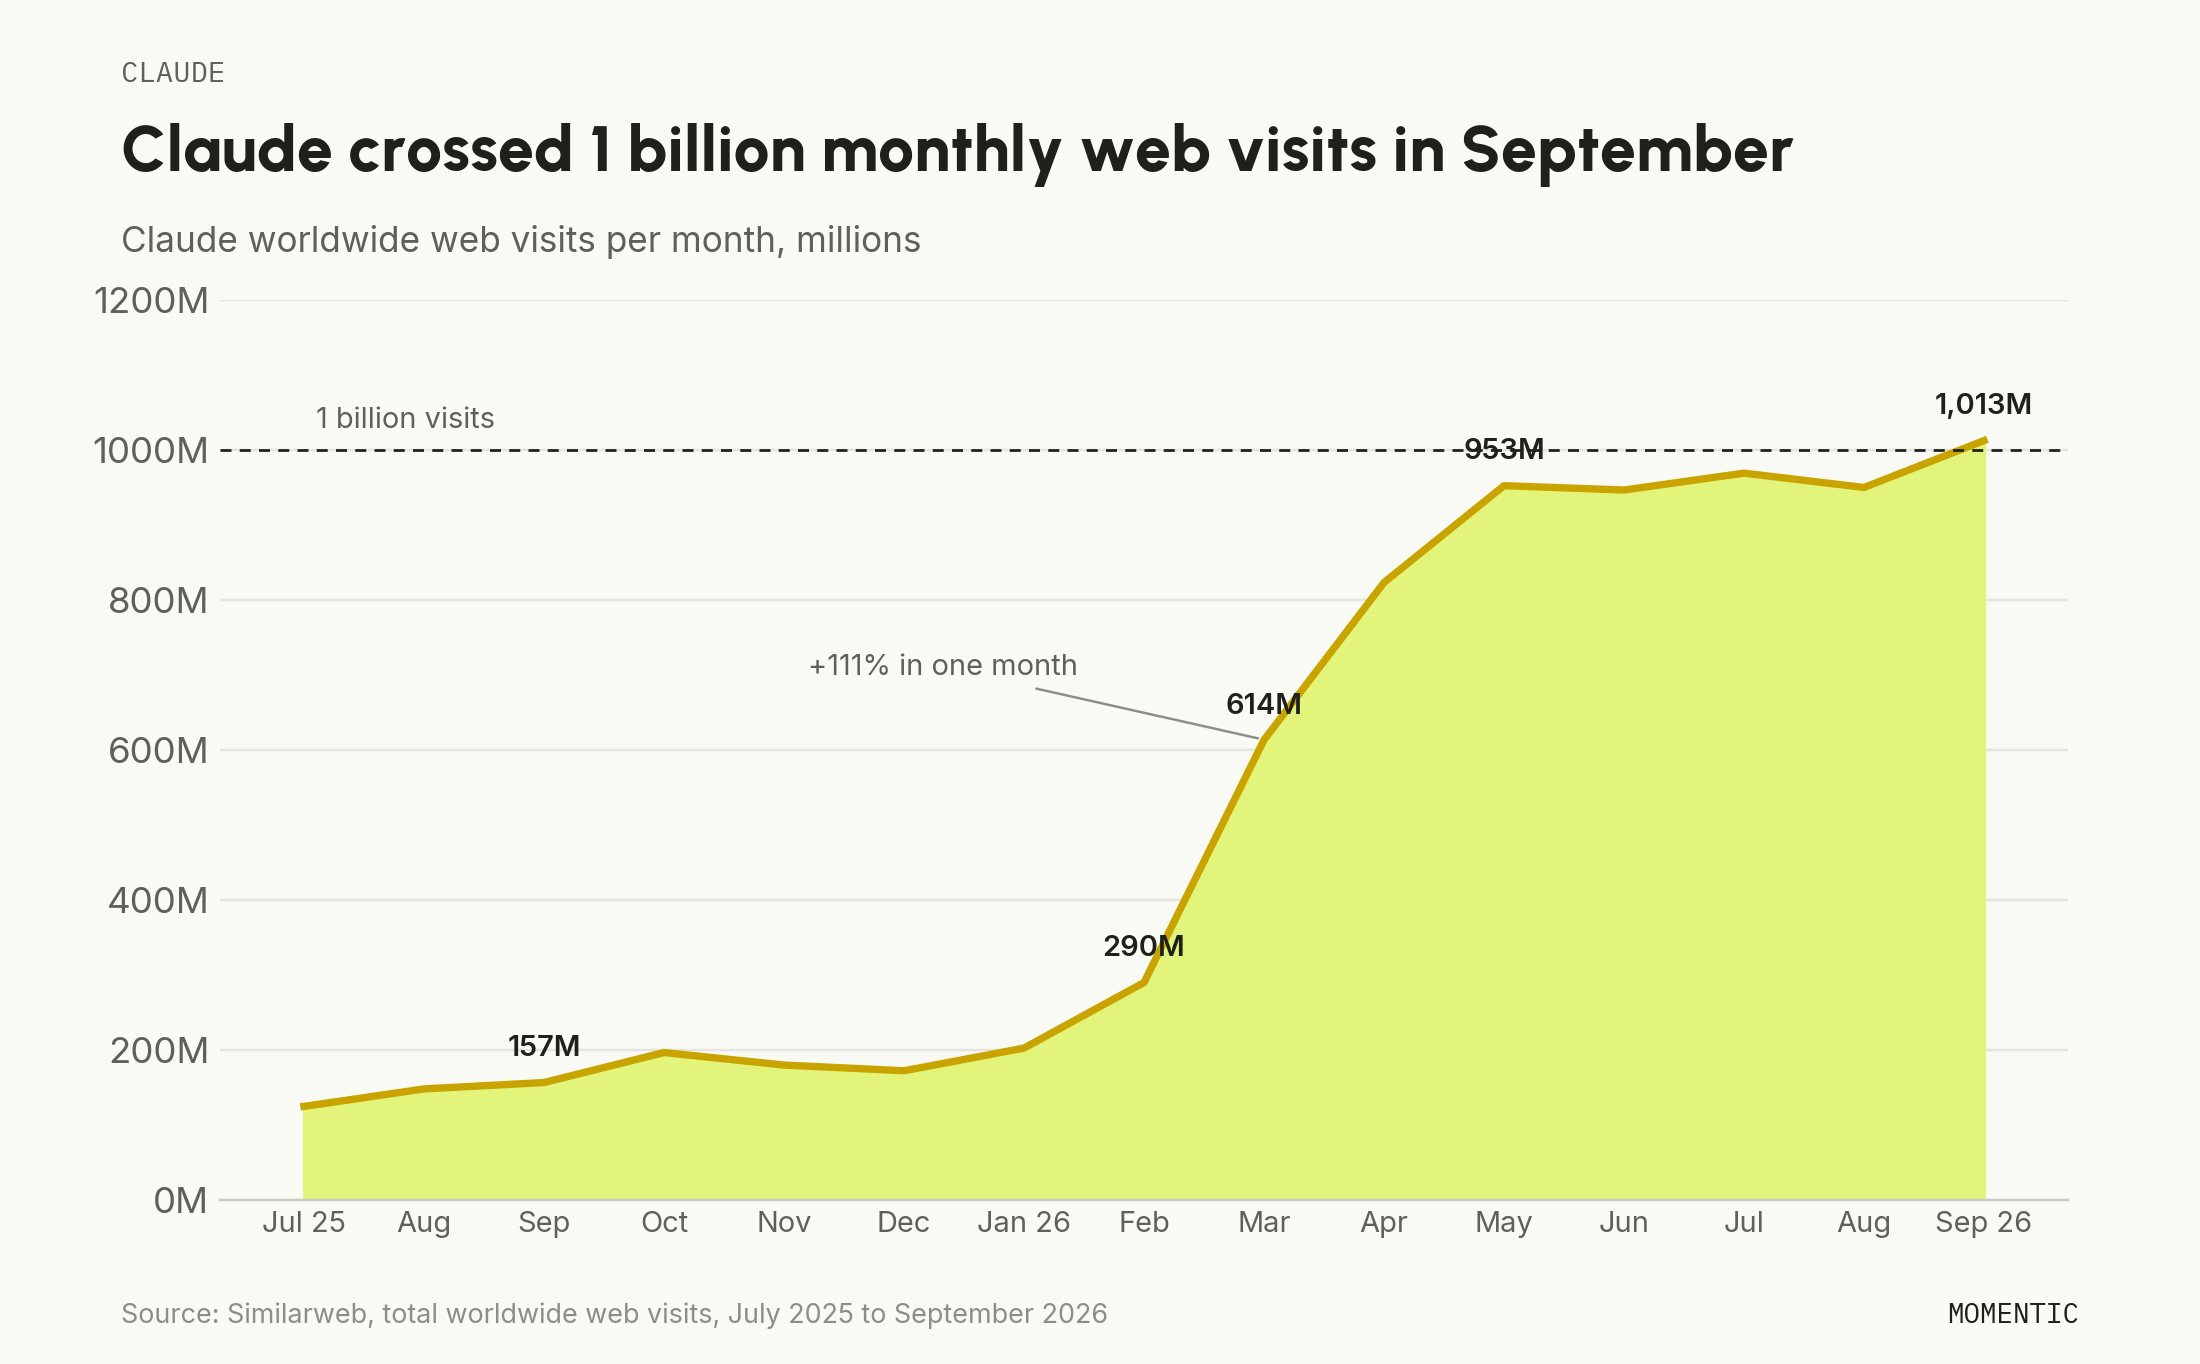
Claude's growth appears to be picking up again. In the first 11 days of October 2026, Claude's worldwide web visits ran 17.6% above the same weekdays in early September, while every other assistant was flat or lower, which lifted Claude's share of the seven to 11.0% for that period. Anthropic released Claude Opus 5.5 on September 22 and Claude Sonnet 5.5 on September 28, 2026, and the rise began that week: Claude's weekday web visits climbed from about 36 million a day in early September to between 42 million and 44 million a day on October 5 to 7. In the United States, Claude drew 240.2 million web visits in September 2026, up 415% year over year, for a 13.2% US share. Claude's US share is higher than its worldwide share because the US accounts for 23.7% of its visits.
Which AI chatbot is growing the fastest in 2026?
Ranked by quarterly web-visit growth from June to September 2026, ChatGPT (+10%) and Claude (+7%) are the only assistants that grew. Grok (-3%), DeepSeek (-4%), Gemini (-8%), Perplexity (-21%), and Microsoft Copilot (-46%) declined. Over a full year, Claude grew fastest (+545%), followed by Gemini (+150%).

Source: Similarweb, worldwide total web visits. MoM compares August 2026, quarterly compares June 2026, six-month compares March 2026, YoY compares September 2025.
The horizons tell different stories. Gemini is up 150% year over year but down 8% over the quarter, because its climb ended in May. Grok is up 16% year over year but down 37% over six months from a March 2026 peak of 326 million visits. Read a single growth figure as the net change between two dates, not as a steady rate.
Which AI chatbot is declining the fastest?
Perplexity and Microsoft Copilot are declining the fastest by web visits. Perplexity's worldwide web visits fell 46% year over year, from 169.5 million in September 2025 to 91.7 million in September 2026, and have fallen in every month since March 2026. Microsoft Copilot's standalone web app fell 46% in a single quarter, to 64.4 million visits in September 2026, its lowest month in the 15 months of data.
What happened to Microsoft Copilot's web traffic?
Microsoft Copilot's spring 2026 web traffic looks like a temporary surge of low-engagement visits. In the United States, copilot.microsoft.com jumped from 21.5 million visits in February 2026 to 39.9 million in March, and its monthly unique visitors rose from 3.8 million to 17.2 million. Its US bounce rate rose at the same time from 34% to 66%, and stayed between 66% and 69% through June. In July 2026, US visits fell to 17.6 million, unique visitors to 3.1 million, and the bounce rate to 29%, close to where all three stood before March.
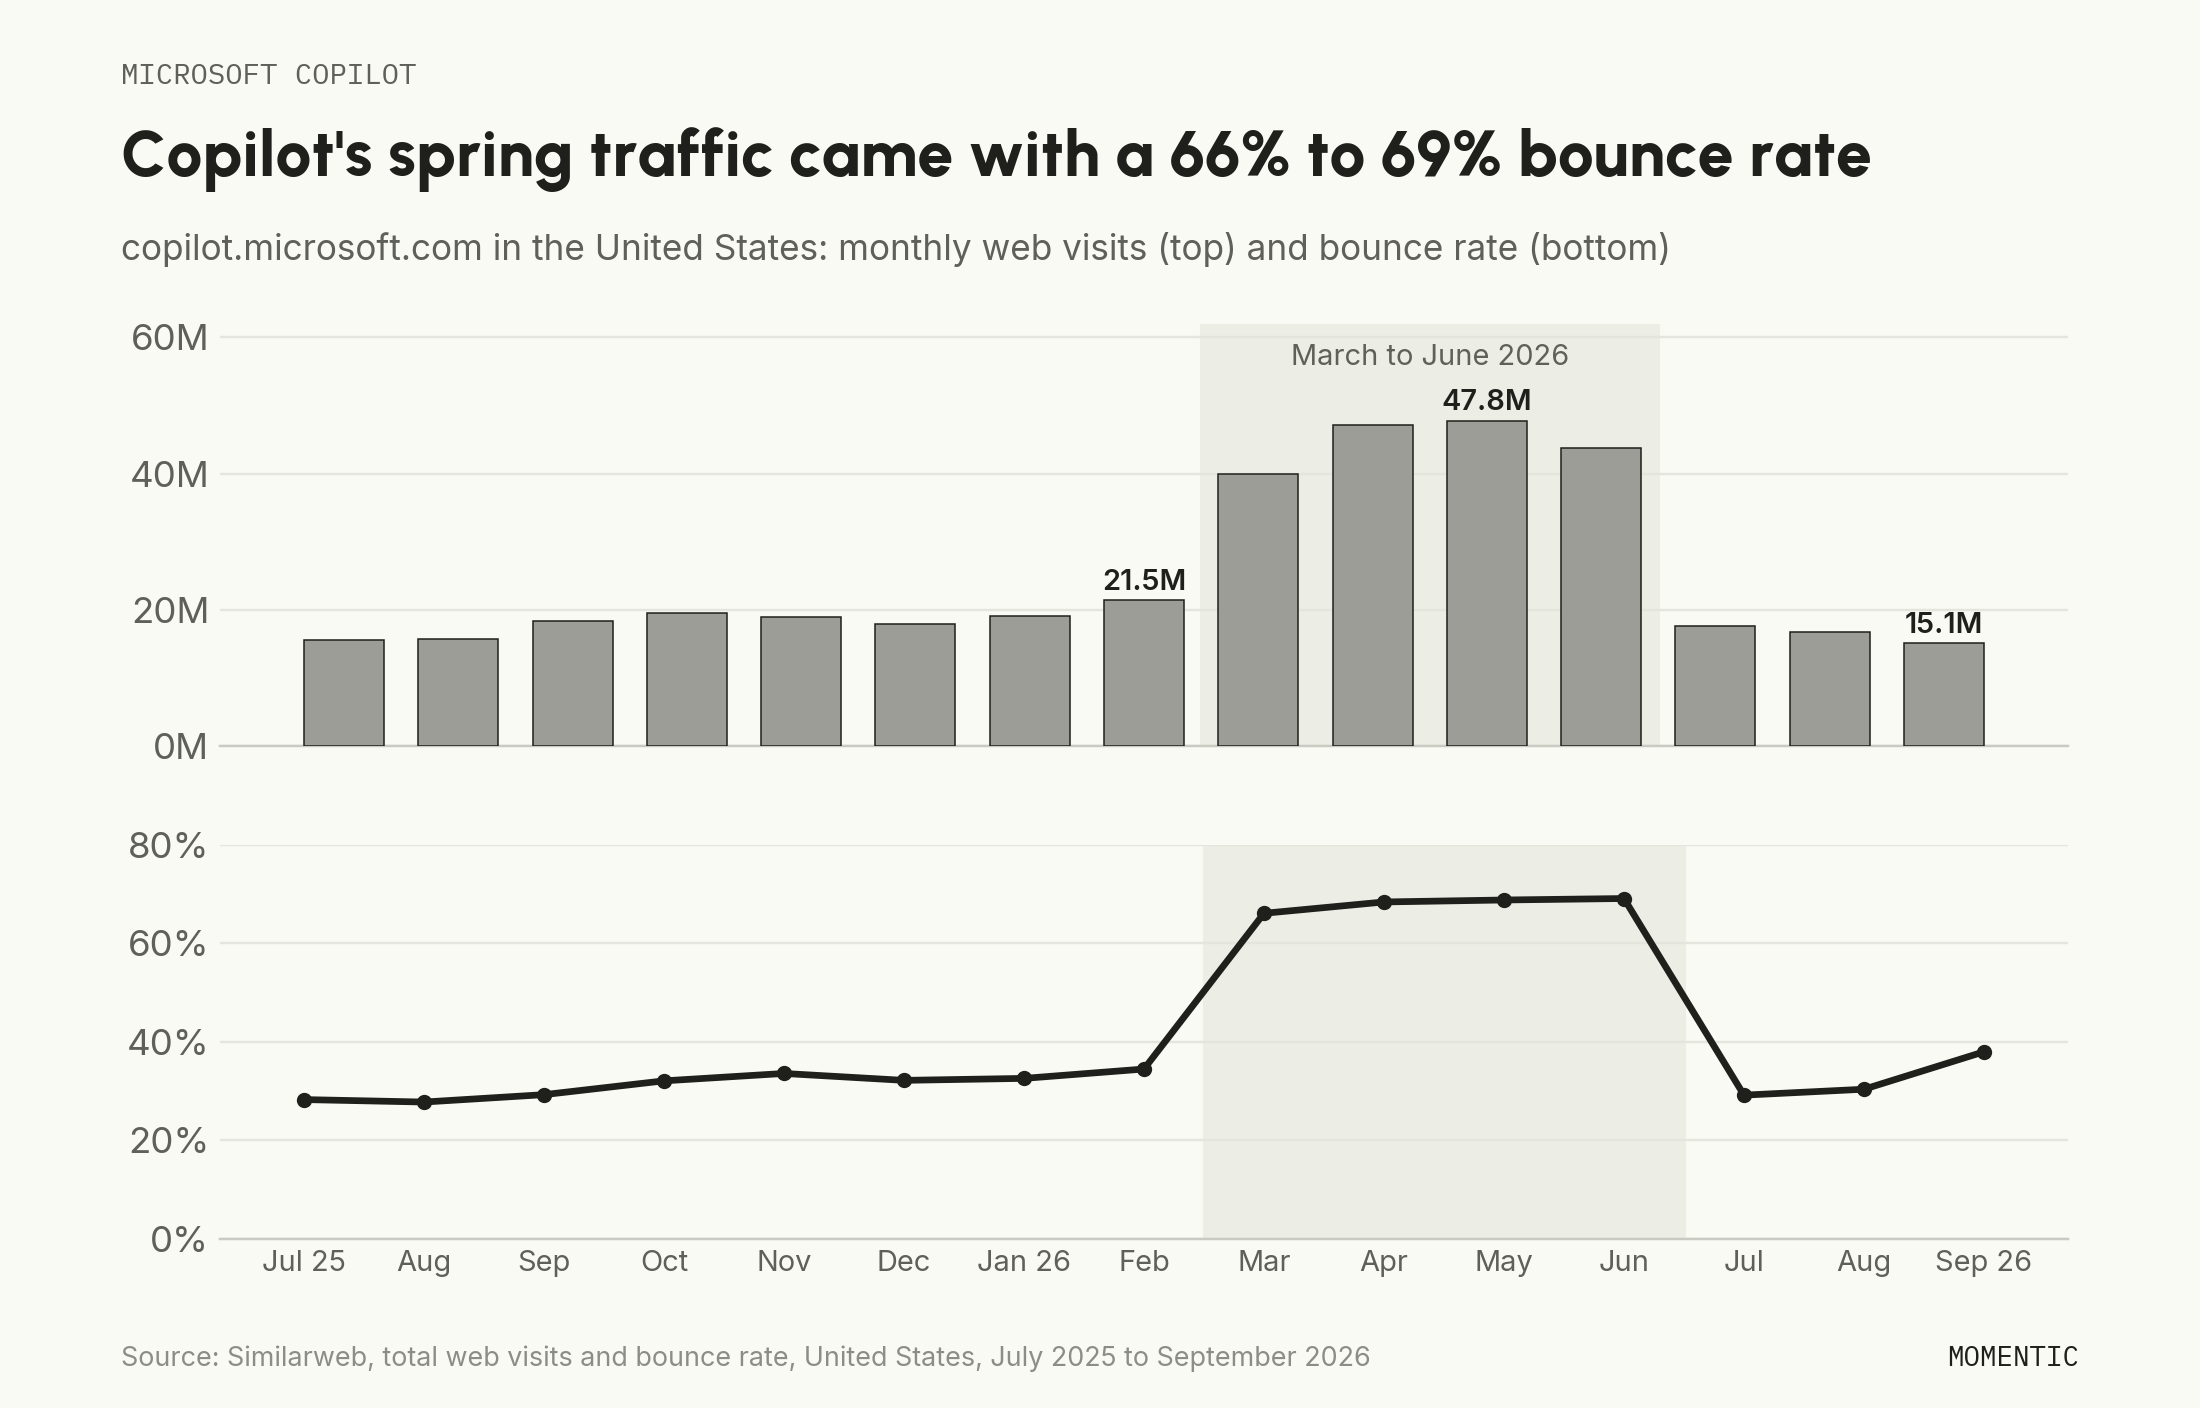
A spike in visitors with a matching spike in bounce rate fits traffic sent to the page from another entry point, such as a link or redirect inside a Microsoft product, rather than people choosing to use the web app. Most Copilot usage runs inside Windows, Edge, and Microsoft 365, so the 0.6% web-visit share understates Copilot's reach more than for any other assistant. Read the spring 2026 Copilot figures in earlier editions of this report with that in mind.
Which AI chatbot is most popular in each country?
ChatGPT is the most-used AI chatbot by web visits in 16 of the 18 countries this report breaks out beyond the United States in September 2026. Gemini leads in Italy with 44.8% of the seven assistants' visits against ChatGPT's 43.5%. DeepSeek leads among these seven assistants in China at 73.2%. ChatGPT's lead is narrowest in Vietnam (46.8% to Gemini's 43.5%), Turkey (48.4% to 43.0%), and Mexico (47.1% to 39.2%), and widest in the United Kingdom (68.2%), Australia (66.6%), and Brazil (65.1%).

Source: Similarweb, total web visits by country, September 2026. Each cell is that assistant's share of the seven assistants' combined visits in that country. Countries are ordered by the seven assistants' combined visits. China figures cover only these seven assistants; domestic Chinese assistants such as Doubao, which are not in the set, are larger there.
In Australia, Claude is second at 15.5%, ahead of Gemini's 12.5%, the only country in the table where Claude outranks Gemini. In Russia, DeepSeek holds 32.1%, and Perplexity's 3.6% is its highest share of any country in the table. Japan, Indonesia, Vietnam, Mexico, Turkey, and Italy all give Gemini more than a third of visits, while the United Kingdom, Australia, and Canada give it less than a fifth.
Where does each AI chatbot's traffic come from?
The United States is the largest country for six of the seven assistants, and China is the largest for DeepSeek. In September 2026, the US supplied 19.5% of ChatGPT's web visits, 12.0% of Gemini's, and 23.7% of Claude's. DeepSeek drew 44.5% of its visits from China and 10.9% from Russia, with the US third at 5.5%. Gemini is the most geographically spread of the seven, and DeepSeek the most concentrated.
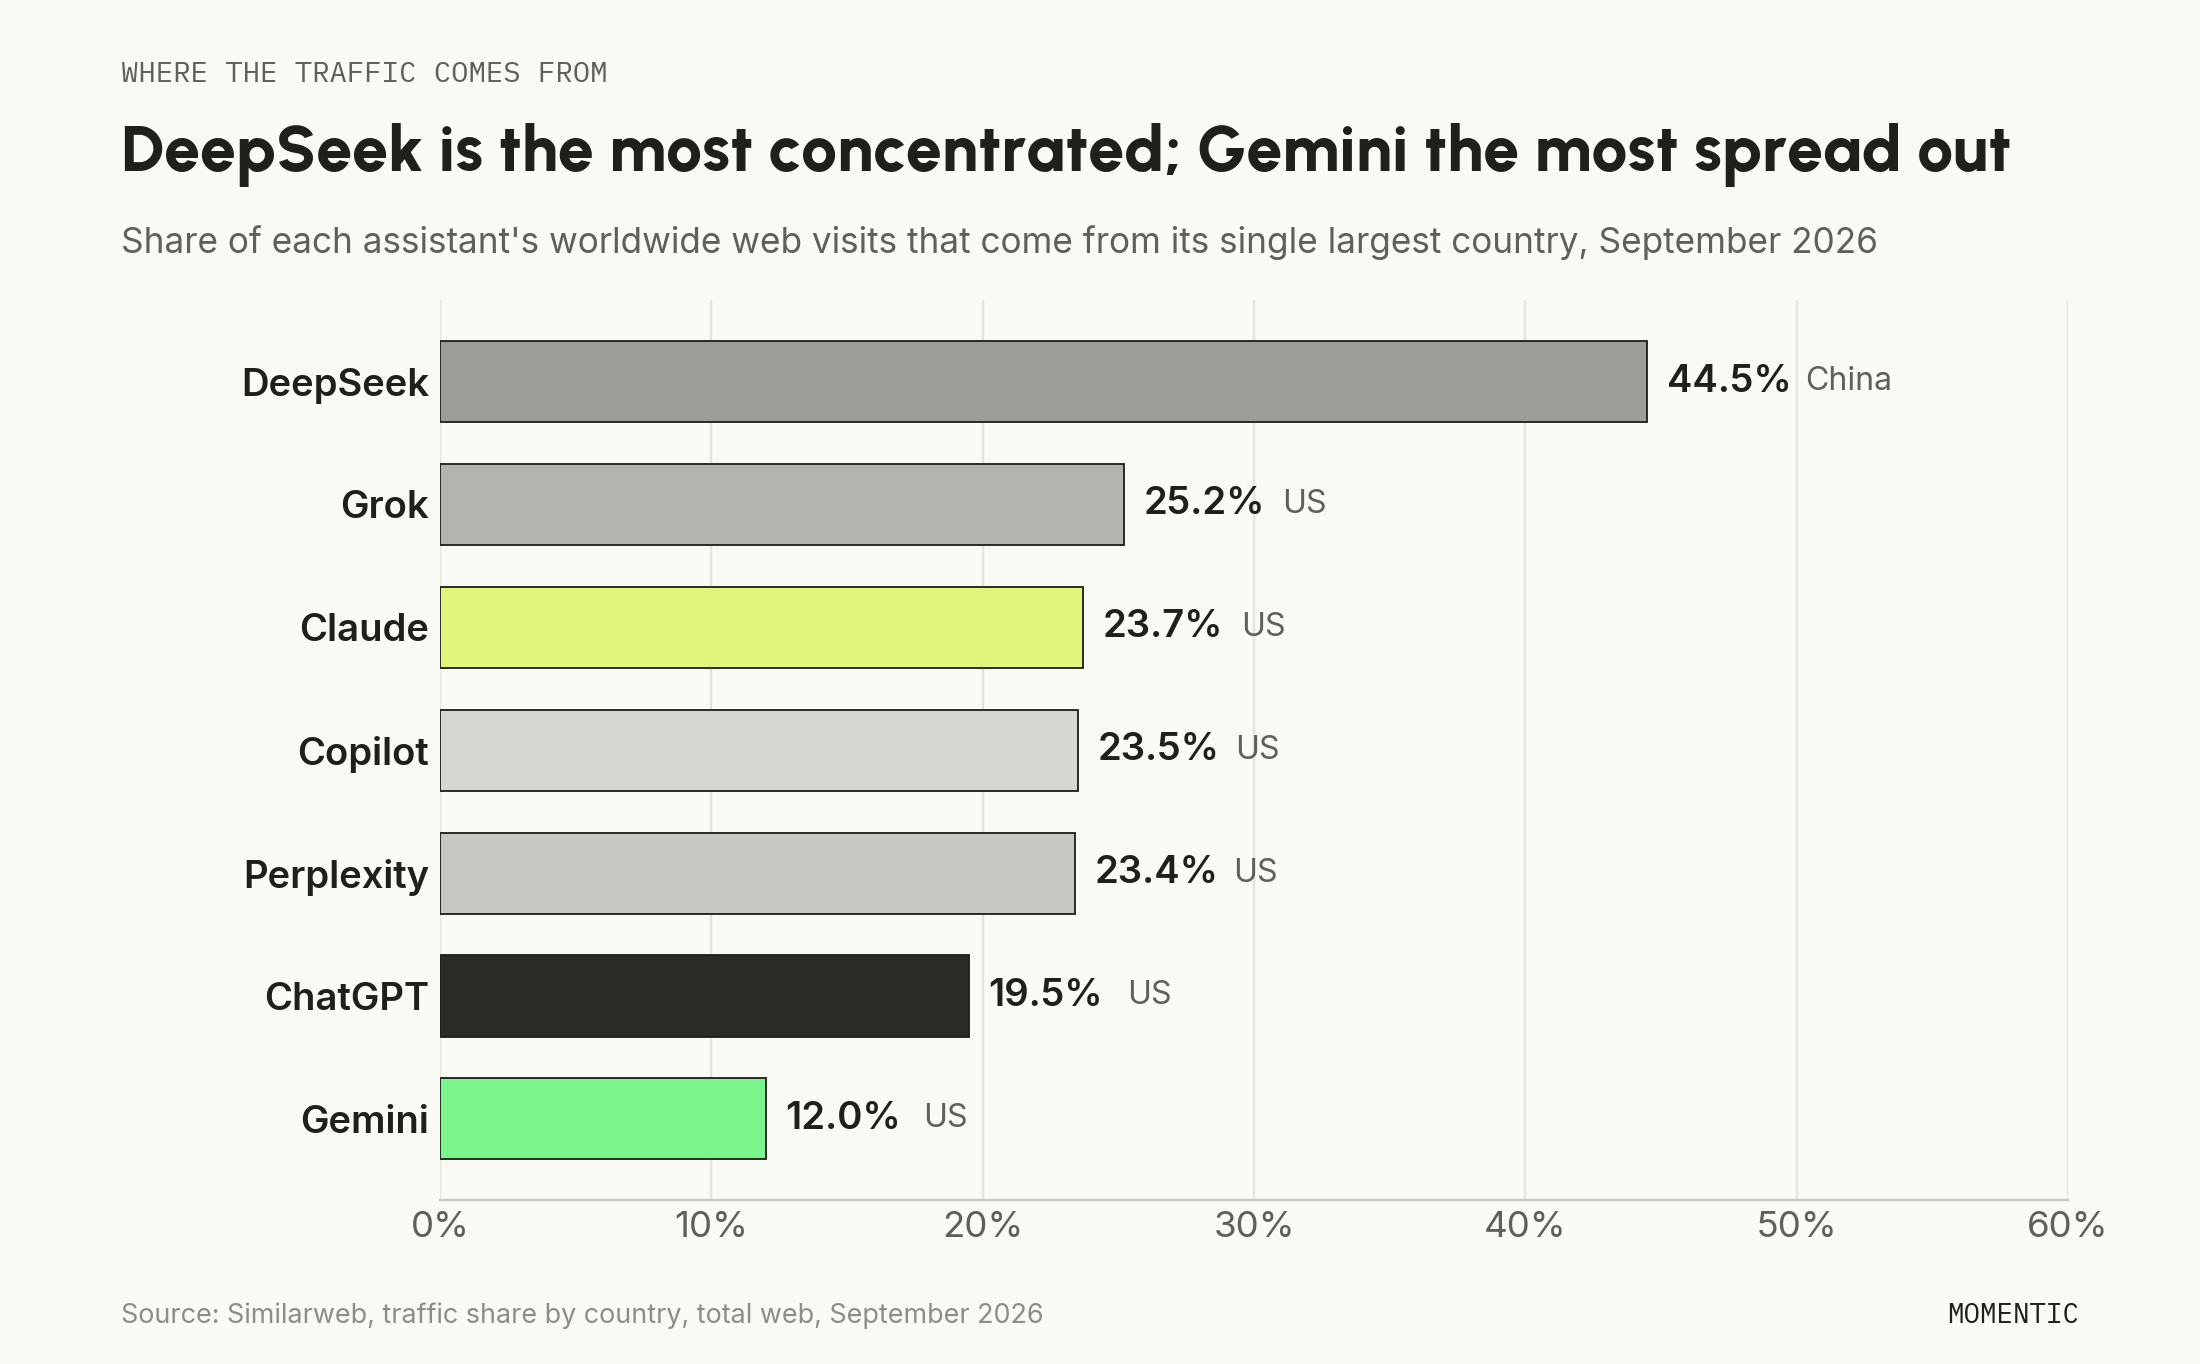
Source: Similarweb, share of each assistant's own total web visits by country, September 2026.
India is the second-largest country for four of the seven assistants: ChatGPT, Claude, Grok, and Perplexity. DeepSeek's base explains why its worldwide share (3.5%) is three times its US share (1.1%).
How many people use each AI chatbot?
ChatGPT drew 492.6 million monthly unique web visitors worldwide in September 2026, the most of any assistant, followed by Gemini (313.1 million) and Claude (119.0 million). These counts cover each assistant's website only and exclude iOS and Android apps. Companies report larger figures that include apps: OpenAI said 1.2 billion people use ChatGPT each week at its DevDay on September 29, 2026, and Alphabet reported 950 million monthly active users for the Gemini app on July 22, 2026.
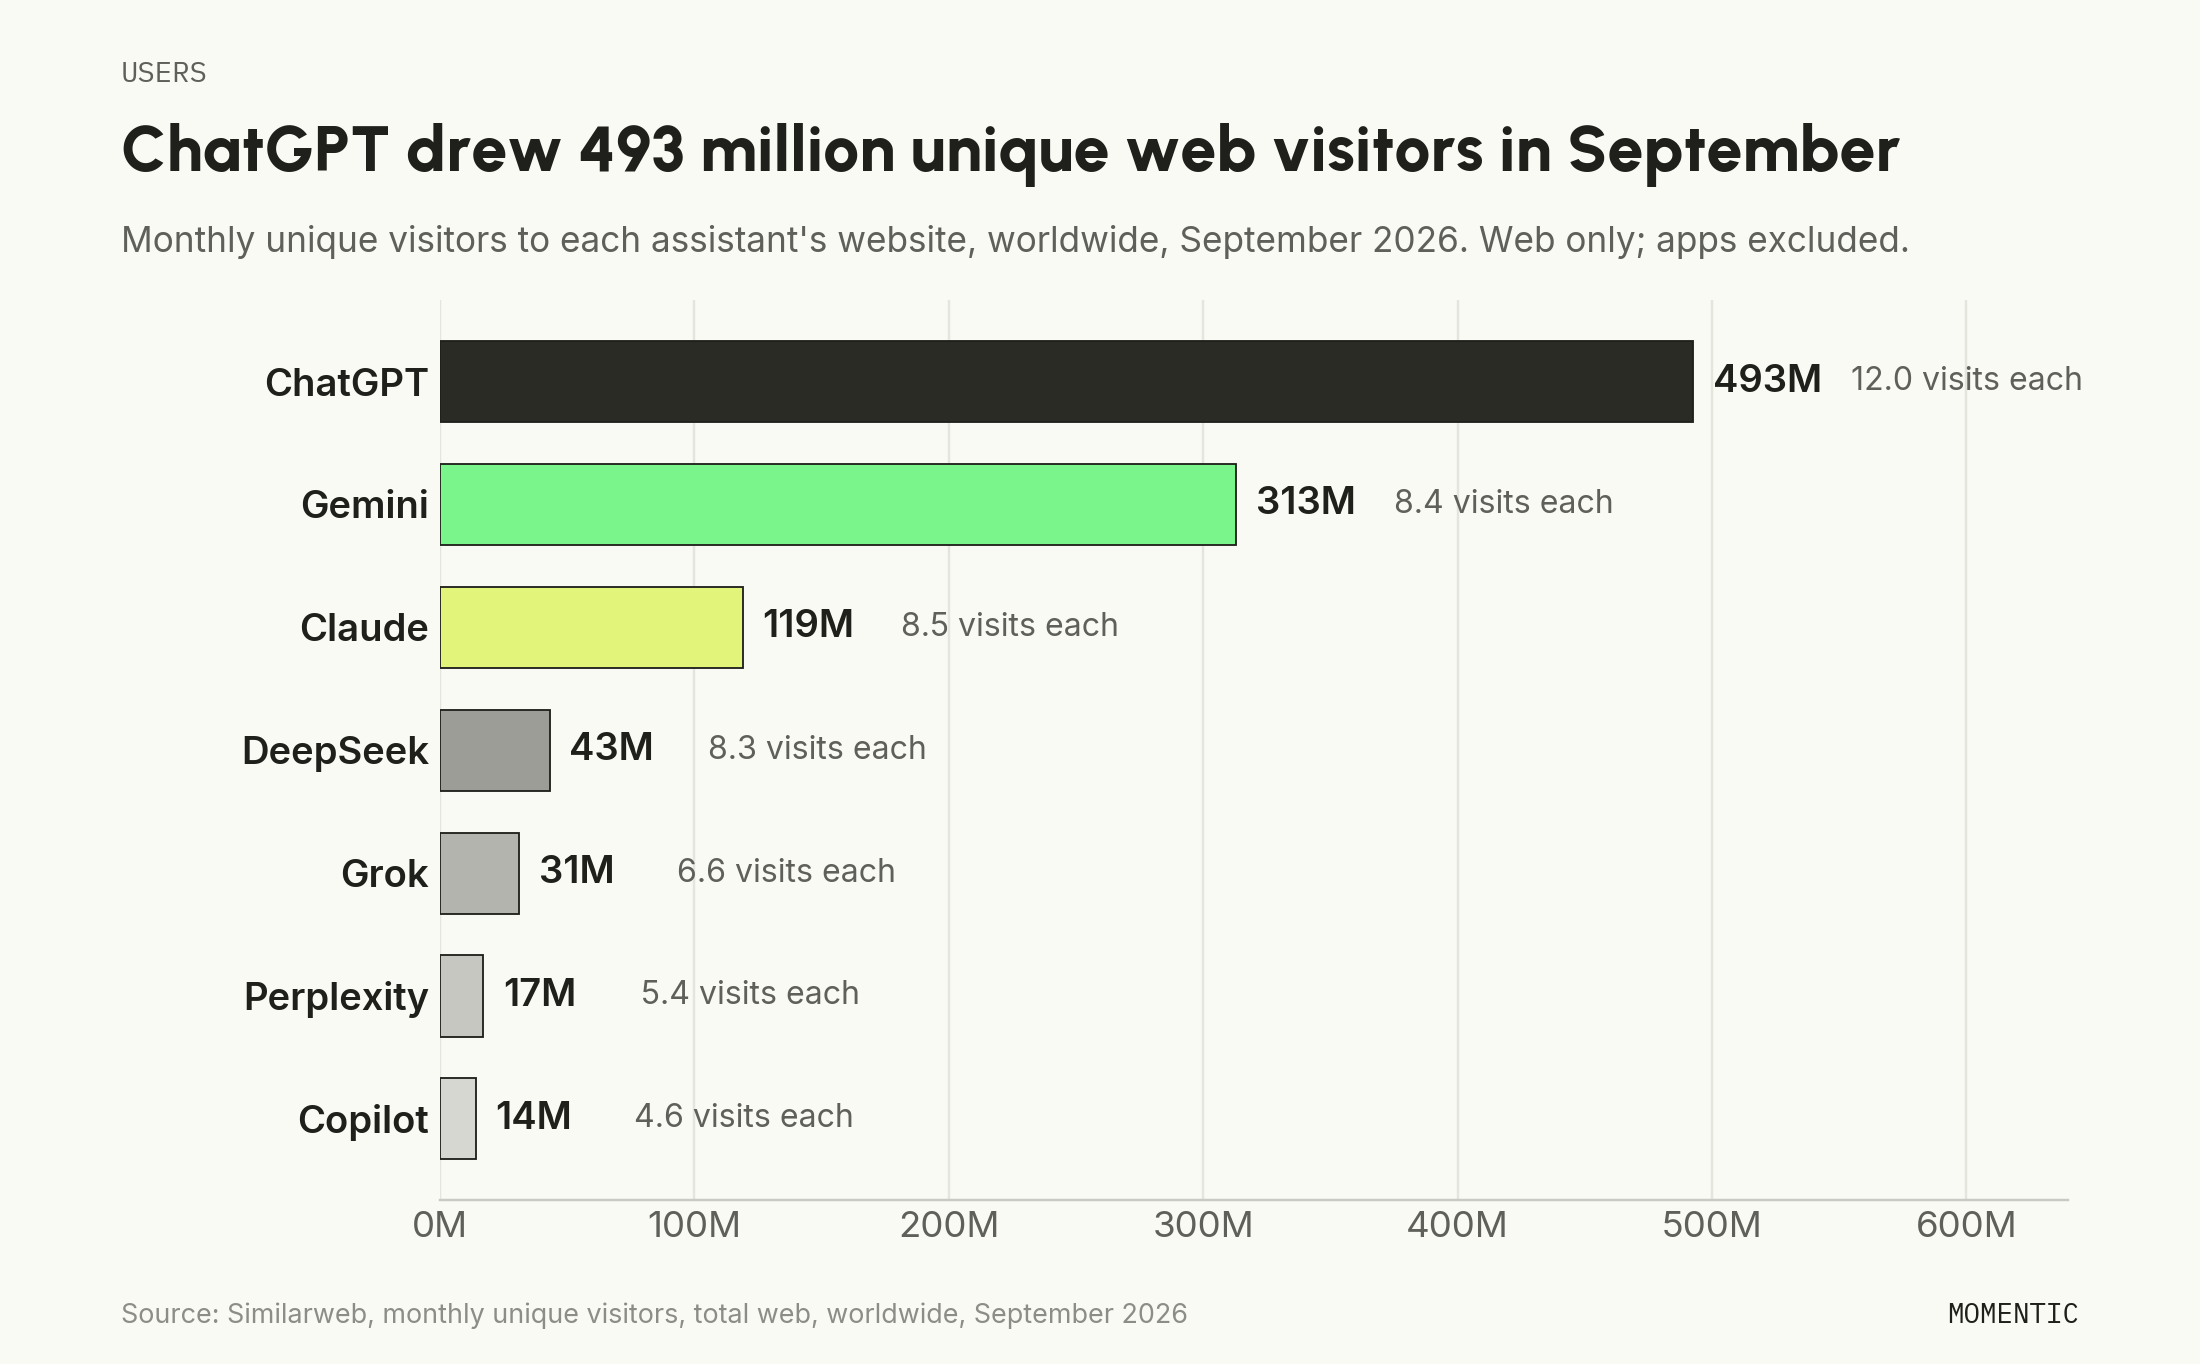
Source: Similarweb, monthly unique visitors, total web, worldwide, September 2026. Company-reported figures from the OpenAI DevDay 2026 recap and Alphabet's Q2 2026 earnings remarks; they are self-reported and use different definitions and dates.
ChatGPT's visitors return most often, at 12.0 web visits per visitor in September 2026, against about 8.4 for Gemini and Claude. Unique visitor counts are not deduplicated across assistants, so one person who uses three assistants counts three times, and the seven figures cannot be added into a single total of AI chatbot users.
How much does web traffic undercount app usage?
Web visits undercount total usage by roughly 15% to 60% depending on the assistant, because native iOS and Android apps carry usage that does not appear in web data. The latest platform breakdown available for this report is for the United States in May 2026. It counts active users by device, a different metric from web visits, and is not deduplicated across platforms, so read it as a directional measure of where each assistant's usage lives.
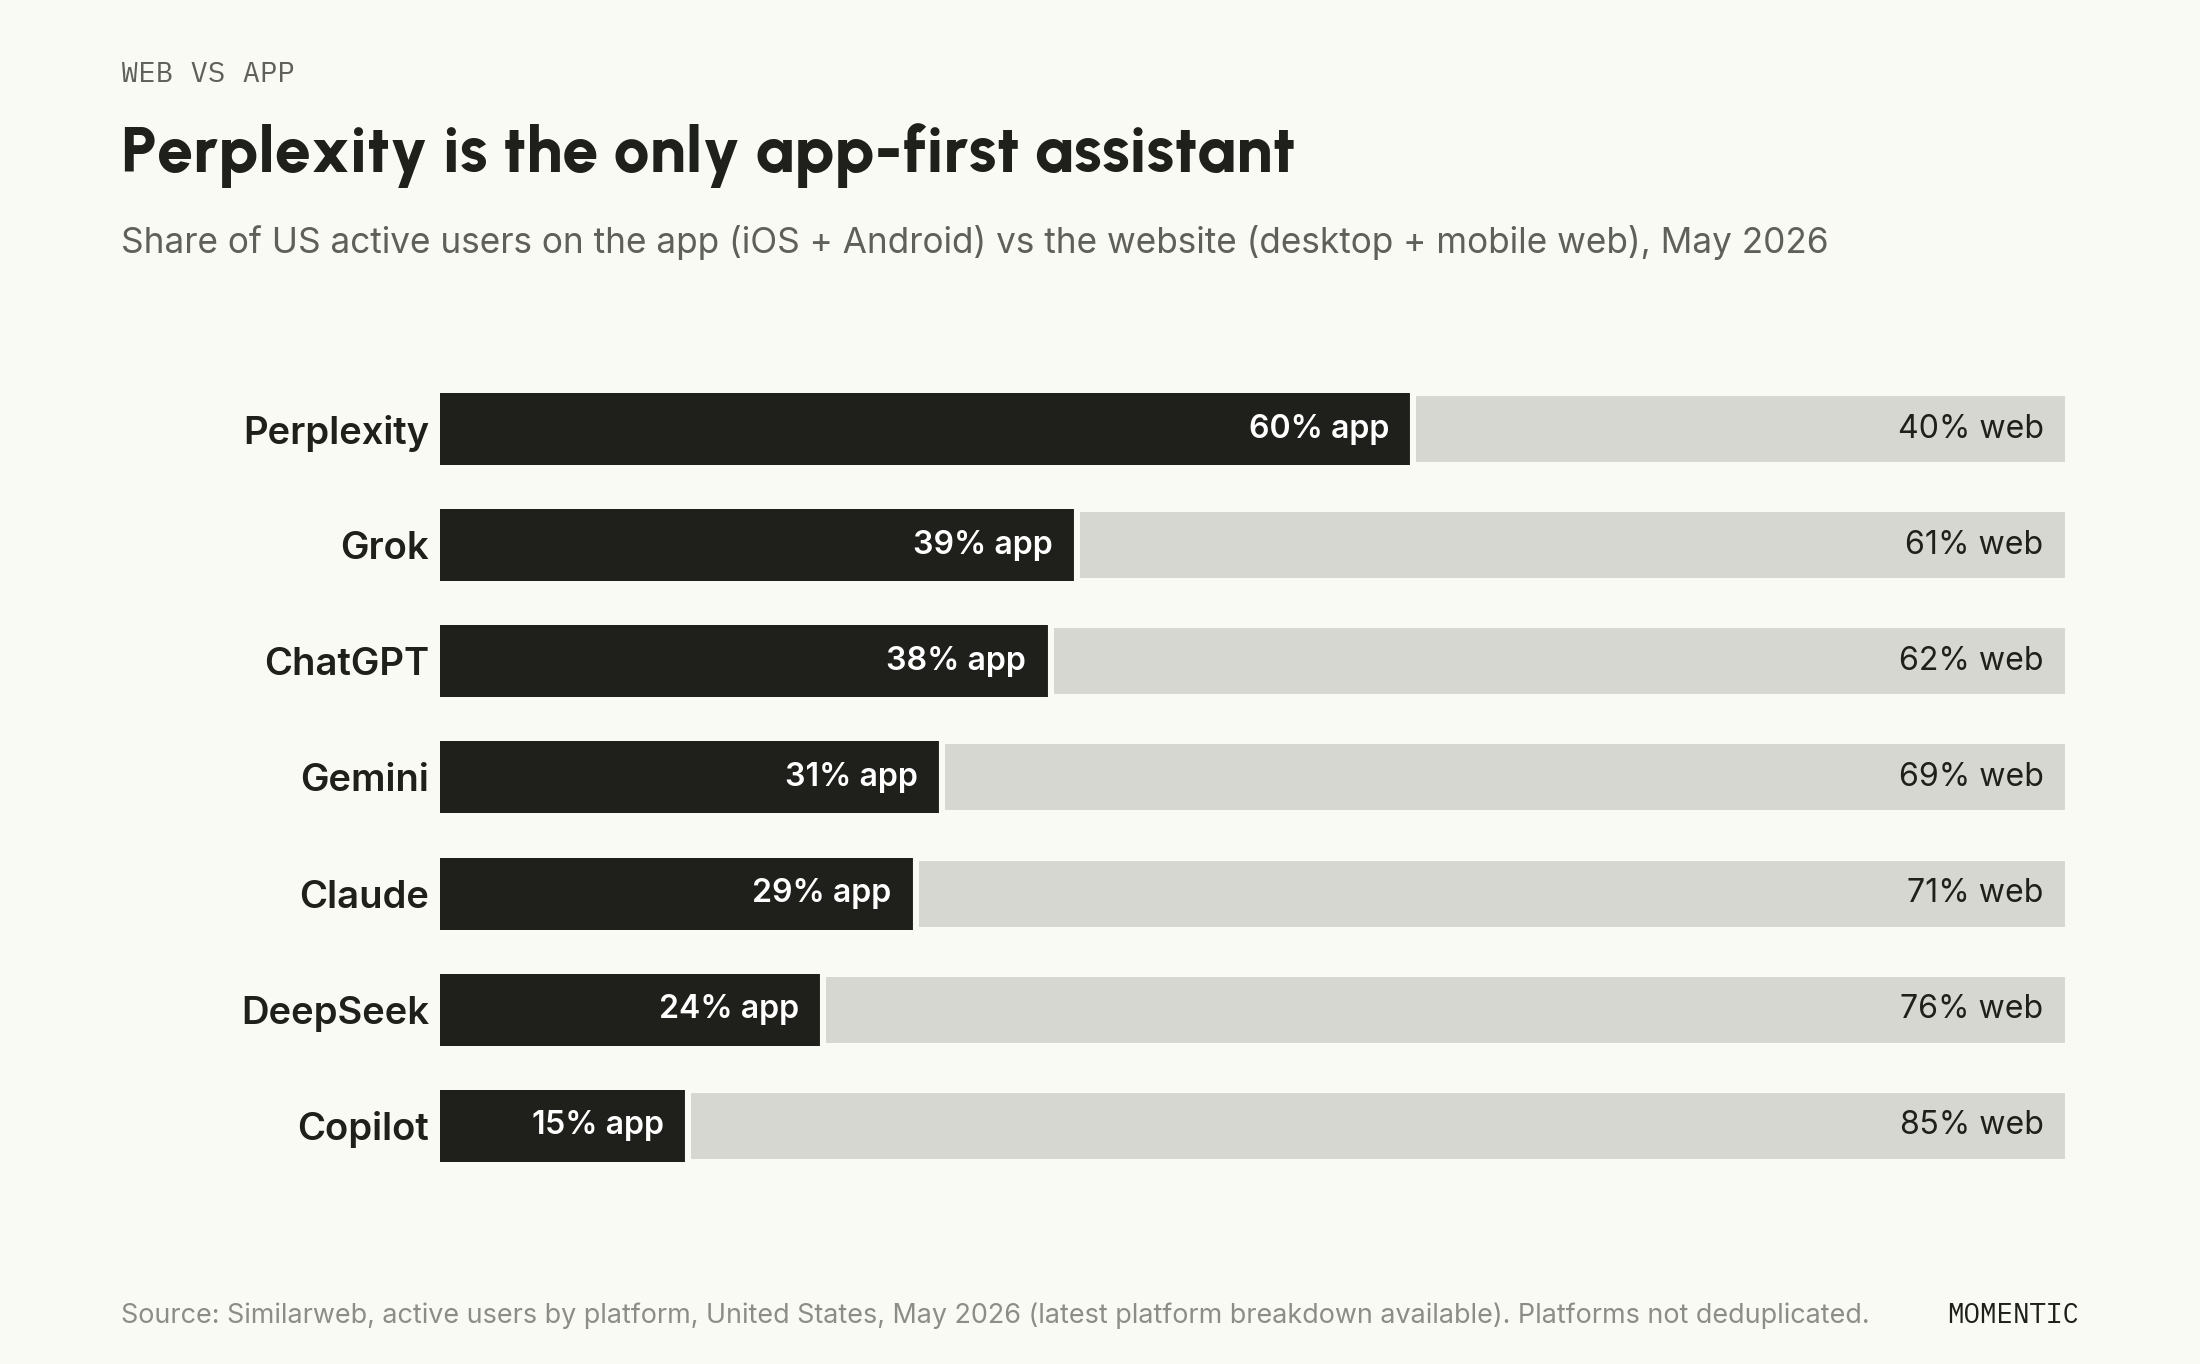
Source: Similarweb, active users by platform, United States, May 2026. Platforms are not deduplicated, so totals are not additive. The May 2026 Copilot web figure falls inside the spring surge described above.
Perplexity is the only assistant whose app users outnumber its web users, so its 0.9% web-visit share understates its reach more than any other in the set. ChatGPT and Grok draw close to 40% of their US users through apps.
Which AI chatbots have the highest user engagement?
By September 2026 engagement metrics, Grok has the longest web sessions and Microsoft Copilot the shortest. Grok averaged 10 minutes 24 seconds and 9.6 pages per visit, more than 50% longer than any other assistant. ChatGPT now has the lowest bounce rate of the seven at 24.9%, followed by Gemini at 27.2% and Claude at 28.0%.
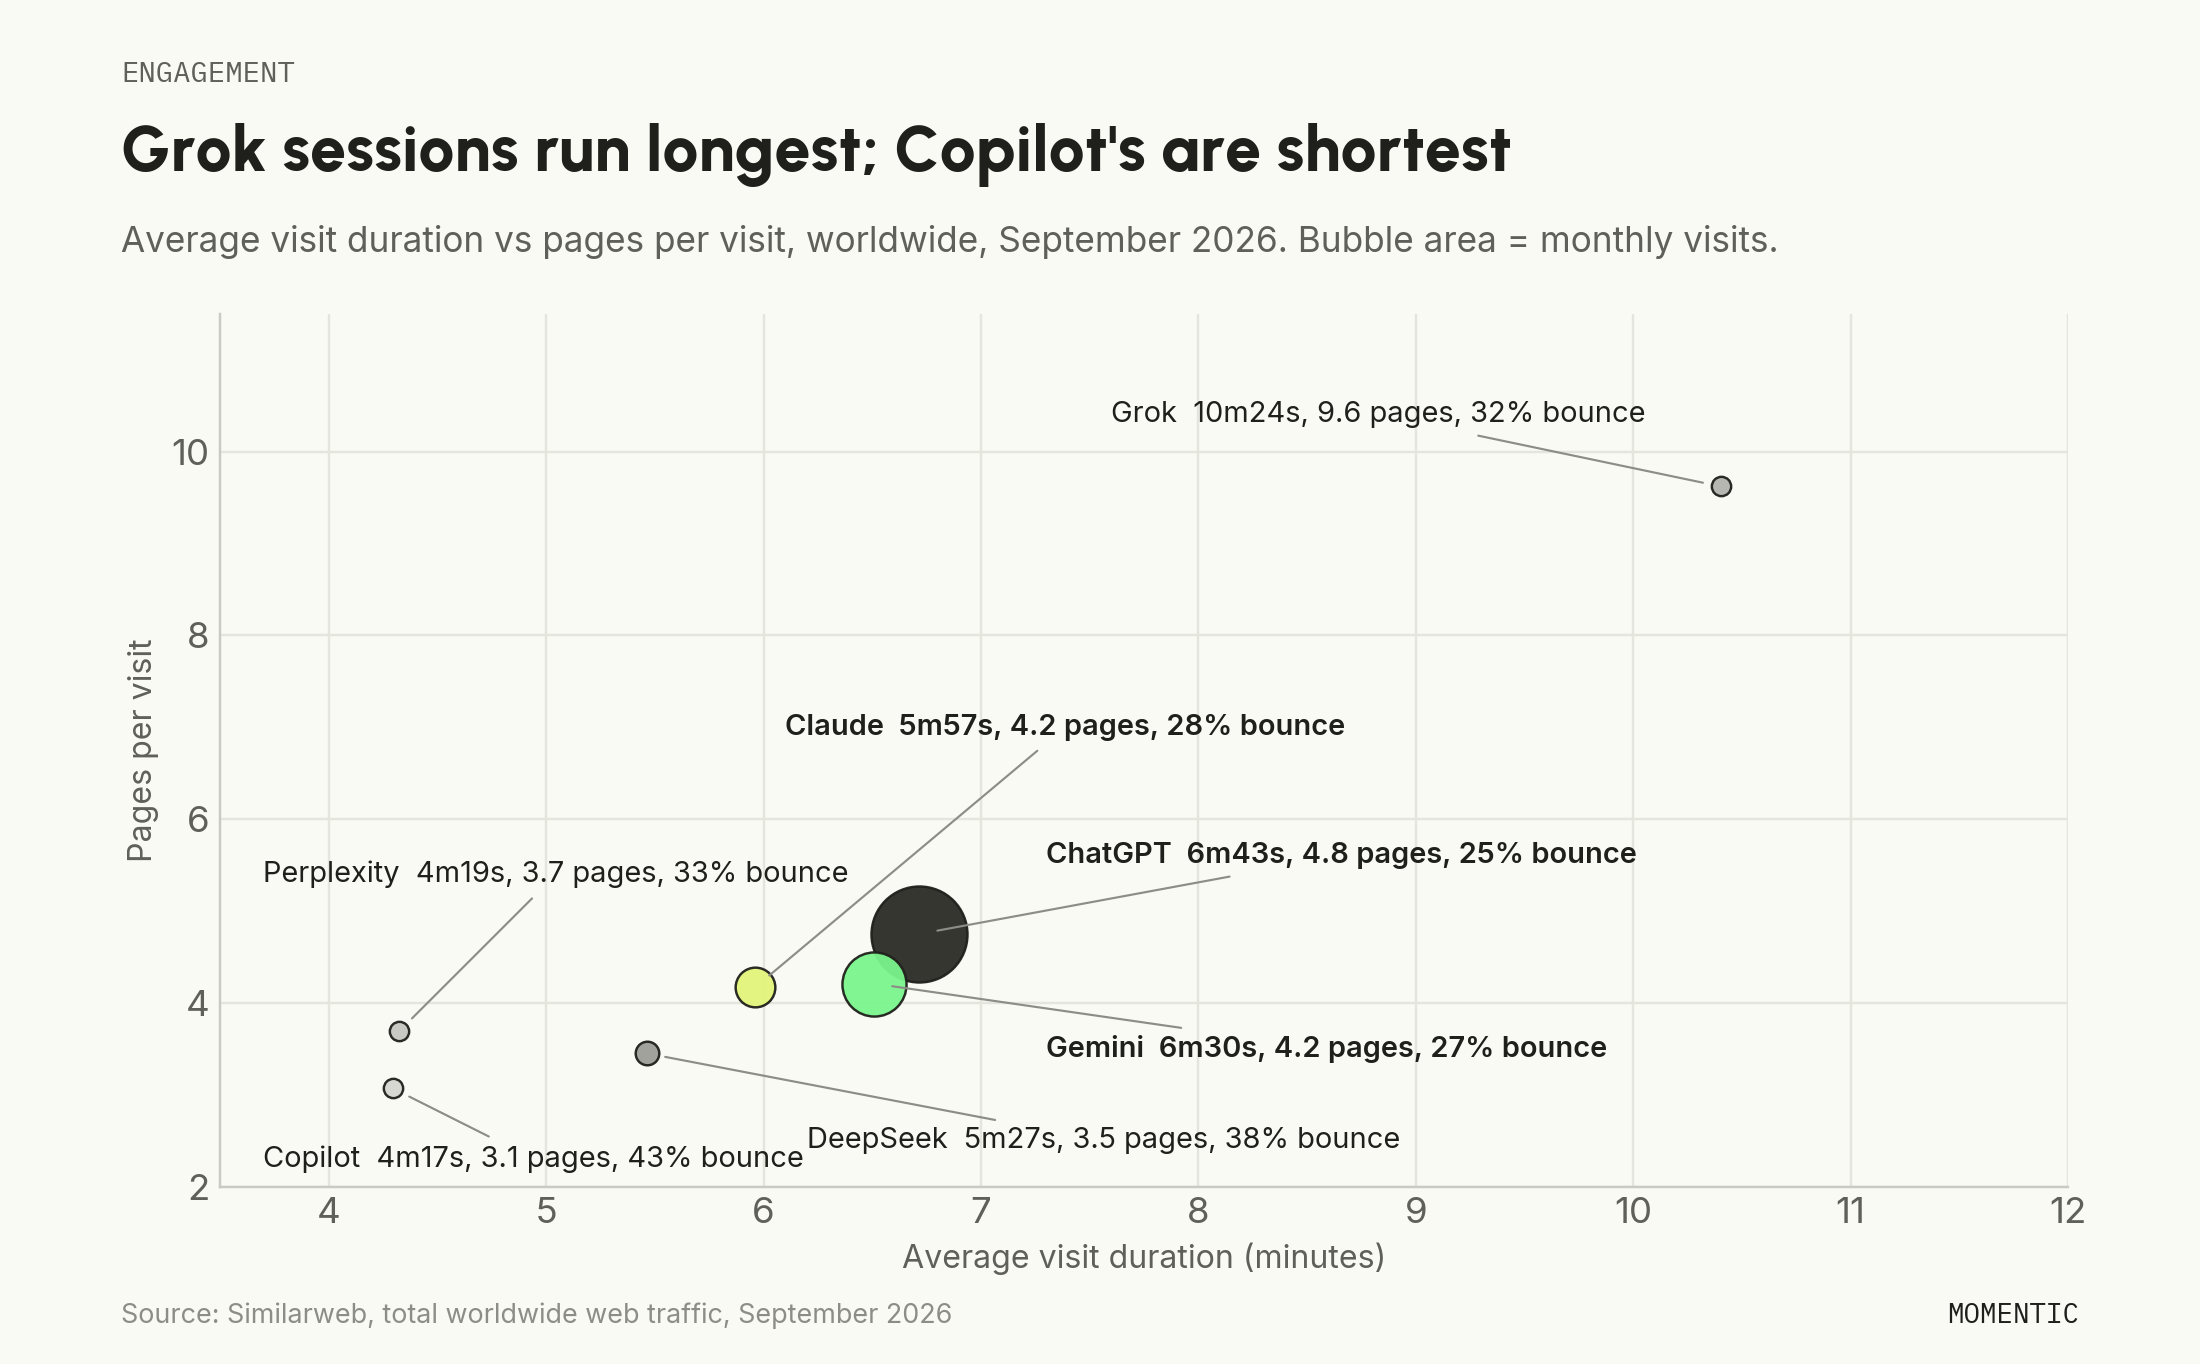
Source: Similarweb, total worldwide web traffic, September 2026.
Grok's session length has fallen from a peak of 12 minutes 58 seconds in February 2026, and its pages per visit from 21.4 to 9.6, but it remains an outlier, likely because grok.com bundles activity beyond chat and is entangled with X. Treat both its engagement and its visit counts as directional. Claude's bounce rate rose from 25.2% in June to 28.0% in September, the opposite direction from ChatGPT's.
How do the models behind the leading assistants compare?
The September 2026 flagship models behind the leading assistants launched at lower or equal list prices than the flagships of May 2026, and none of them published GPQA Diamond or SWE-bench Verified scores, the two benchmarks earlier editions of this report used to compare them. OpenAI released GPT-6 Sol on September 22 at $2 input and $10 output per million tokens, against GPT-5.5's $5 and $30. Anthropic released Claude Opus 5.5 on September 22 at $4 and $20, against Claude Opus 4.8's $5 and $25. Google released Gemini 4 Argon on September 30 at $2 and $10, and xAI released Grok 4.7 on September 21 at an unchanged $2 and $6.

Data from DemandSphere AI Frontier Model Tracker, updated October 19, 2026, used with permission. GPT-6 Sol is the mid tier of the GPT-6 line; GPT-6 Astra ($10/$50) is the top tier. Copilot routes to OpenAI and Microsoft MAI models, and Perplexity routes queries to third-party models, so neither lists a separate base model.
The labs moved their headline claims to agentic and task benchmarks such as OSWorld, AutomationBench, and Terminal-Bench, and DemandSphere notes that Anthropic now considers GPQA saturated, so published figures no longer support a single like-for-like capability column across the five makers. Price is where the models now differ most: Grok 4.7's output price is 40% below GPT-6 Sol's, and DeepSeek V4 Pro's open weights list at about a third of GPT-6 Sol's output price, a price gap that coincides with DeepSeek's strength in Russia and China. Model releases can coincide with usage changes, as with Claude's early-October rise after Opus 5.5 and Sonnet 5.5, but a release does not reliably move web share on its own: GPT-6 Astra's general availability in September came with a 5% ChatGPT gain that matches its usual seasonal pattern.
What is the early-October 2026 trajectory?
Through October 11, 2026, Claude is the only large assistant gaining web visits. Comparing October 1 to 11 with the same weekdays in September (September 3 to 13), Claude's worldwide web visits rose 17.6%, ChatGPT's were flat (-0.2%), Gemini's fell 2.5%, DeepSeek's 3.8%, Grok's 4.1%, Perplexity's 5.8%, and Microsoft Copilot's 41.4%. Claude's share of the seven assistants' visits for the period was 11.0%, against 9.8% for all of September.

These figures come from an incomplete month of daily data, so the report's headline stays on September 2026, the latest complete month, and the October reading is offered only as a directional signal. The November 2026 edition will report the full October month.
Why do AI chatbot market share reports disagree?
AI chatbot market share reports disagree mainly because they measure different things. In September 2026, ChatGPT's share is 57.5% of web visits among these seven assistants in this report, and 80.48% in Statcounter's worldwide AI chatbot figure for the same month, which also lists Claude at 0.95%. Statcounter's data comes from tracking code on member websites, which points to measuring how often each assistant sends people to other websites rather than how often people use the assistant. Assistants that cite and link out often score higher on that kind of measure than assistants used mainly for writing or coding, which would explain why Claude ranks far lower there than in visit data. Four methodology gaps drive most discrepancies:
- No stated denominator. A share figure that does not specify users, sessions, visits, referrals, or revenue cannot be reconciled with any measured quantity.
- Undisclosed set of assistants. Adding or removing one assistant changes every other share; a ranking that adds Meta AI or a Chinese assistant will show lower figures for all seven here.
- Undisclosed geographic scope. A US-only ranking raises US-concentrated assistants such as Claude and lowers Asia-heavy assistants such as DeepSeek; a worldwide ranking does the reverse.
- Web versus app blindness. A ranking built on web visits alone undercounts app-first assistants such as Perplexity, where app users outnumber web users.
A ranking is only as credible as the method a reader can inspect, so this report states its metric, set, geography, and month under every table.
AI chatbot market share by users vs. web visits
AI chatbot market share measured by users, app downloads, or revenue ranks the field differently from web visits, and no single public source measures those consistently across assistants. Company-reported user counts use different definitions and dates: OpenAI reports weekly users for ChatGPT, and Alphabet reports monthly active users for the Gemini app. This report found no comparable current user counts published for Claude, Grok, DeepSeek, Perplexity, or the Copilot web app as of October 2026. Revenue share is dominated by API and enterprise contracts that no consumer-usage metric captures. This report uses web visits because it is one defined, reproducible quantity that can be pulled again and audited. Where a question is about users or revenue, read web-visit share as a proxy for consumer web demand.
How is AI chatbot market share measured?
AI chatbot market share in this report is web-visit share: each assistant's monthly visits to its primary web domain, estimated by Similarweb, as a percentage of the seven assistants' combined visits. The headline window is September 2026, the latest complete month as of October 20, 2026. Month-over-month compares August 2026, quarterly compares June 2026, six-month compares March 2026, and year-over-year compares September 2025. The monthly trend runs from July 2025, and the February and May 2025 trend columns are carried from earlier editions. Figures are worldwide unless a country is named. Estimates are panel-modeled, carry an error band rather than decimal precision, and are revised month to month; Gemini's November 2025 share in this edition differs by 0.6 points from the previous edition because of Similarweb revisions and rounding. Single percentages are best read as approximate.
Does web traffic capture total AI chatbot usage?
No. Web traffic understates total AI chatbot usage, and it does so unevenly across assistants. Web visits measure the consumer web product, not total model usage or revenue. Four categories sit outside, or distort, web-visit data:
- Native mobile apps. Every assistant in the set has iOS and Android apps, and the platform table shows apps carrying 15% to 60% of US users depending on the assistant.
- Embedded and ambient surfaces. Most Microsoft Copilot usage occurs inside Windows, Edge, and Microsoft 365, and Gemini runs across the Google app, Android, and Workspace. Entry points from those products can also add low-engagement visits to the web data, as Copilot's spring 2026 surge shows.
- API and enterprise consumption. A large share of OpenAI's, Anthropic's, and Google's token volume runs through APIs that generate no web visit.
- Automated traffic. Panel-and-model estimates can include non-human traffic, and AI domains are common automation targets, which adds noise to any single-month figure.
Web-visit share is a reproducible public view of the consumer web market, and it is not offered as a measure of total usage.
What does AI chatbot market share mean for brands and AI search visibility?
For brands, AI chatbot market share shows where to monitor AI search visibility, which is a different question from where a brand is already cited. ChatGPT and Gemini holding 83.2% of the seven assistants' worldwide web visits in September 2026 means those two assistants shape most AI-mediated brand impressions, so monitoring should start there. The country table changes that priority by market: a brand selling in Italy, Vietnam, Turkey, or Mexico should weight Gemini close to ChatGPT, and a brand selling in Australia or the United Kingdom should treat Claude as a material third surface.
Whether a brand appears in those answers depends on other signals: being indexed and ranking in Google Search, which feeds Gemini and AI Overviews, and being present on the third-party sources these assistants ground answers on, such as review platforms, community threads, and structured listings. With frontier models now competing more on price and agentic tasks than on headline benchmark gaps, the usage race turns more on distribution and grounding than on raw model quality. Off-site presence complements on-site content.
AI search visibility measurement is directional rather than measurement-grade, because assistant answers vary from run to run, no public dataset of real prompts exists, and most prompts are unique. Track it at the topic level as a trend, report usage-share data like this report as the defined quantity it is, and treat share of voice inside AI answers as an estimate.
Frequently asked questions
What are the top AI chatbots in October 2026? By worldwide web-visit share in September 2026, the latest complete month for the October 2026 edition, the top AI chatbots are ChatGPT (57.5%), Google Gemini (25.7%), Claude (9.8%), DeepSeek (3.5%), Grok (2.0%), Perplexity (0.9%), and Microsoft Copilot (0.6%).
What is the most popular AI chatbot in 2026? ChatGPT is the most-used AI chatbot in 2026 by web visits, at 57.5% of worldwide web-visit share and 5.92 billion web visits in September 2026.
What is ChatGPT's market share? ChatGPT held 57.5% of worldwide AI chatbot web-visit share and 63.5% of US web-visit share in September 2026.
What is Gemini's market share? Google Gemini held 25.7% of worldwide AI chatbot web-visit share in September 2026, down from a peak of 28.6% in June 2026, and 17.4% in the United States.
What is Claude's market share? Claude held 9.8% of worldwide AI chatbot web-visit share in September 2026, with 1.01 billion web visits, and 13.2% of US web-visit share.
What is DeepSeek's market share? DeepSeek held 3.5% of worldwide AI chatbot web-visit share in September 2026, with 357.4 million web visits, 44.5% of them from China.
What is Grok's market share? Grok held 2.0% of worldwide AI chatbot web-visit share in September 2026, with 205.5 million web visits, fifth among the seven leading assistants.
What is Perplexity's market share? Perplexity held 0.9% of worldwide AI chatbot web-visit share in September 2026, with 91.7 million web visits, down 46% year over year, though its app users outnumber its web users.
What is Microsoft Copilot's market share? Microsoft Copilot's standalone web app held 0.6% of worldwide AI chatbot web-visit share in September 2026, with 64.4 million web visits, though most Copilot usage runs inside Windows, Edge, and Microsoft 365 and does not appear in web visits.
Is Gemini overtaking ChatGPT? Not on the web. ChatGPT drew 2.2 times Gemini's worldwide web visits in September 2026, up from 1.9 times in May, and Gemini's share has fallen for three months.
Which is bigger, Gemini or Claude? Google Gemini is bigger. Gemini drew 2.64 billion worldwide web visits in September 2026 against Claude's 1.01 billion, about 2.6 times as many.
Which is bigger, ChatGPT or Claude? ChatGPT is bigger. ChatGPT drew 5.92 billion worldwide web visits in September 2026 against Claude's 1.01 billion, about 5.8 times as many, and 4.8 times as many US web visits.
What is the best AI chatbot? This report measures usage, not quality. By usage, ChatGPT leads with 57.5% of worldwide web visits in September 2026. Which assistant fits best depends on the task. Among the flagship models in the table above with published scores, GPT-5.5 (88.7%) and Claude Opus 4.8 (88.6%) led SWE-bench Verified for coding, and Gemini 3.1 Pro (94.3%) led GPQA Diamond for science reasoning.
Which AI chatbot is growing the fastest? Claude is growing the fastest over a year, up 545% in worldwide web visits from September 2025 to September 2026, and it posted the largest early-October gain (+17.6%). Over the June to September 2026 quarter, ChatGPT grew 10% and Claude 7%.
Which AI chatbot is declining the fastest? Microsoft Copilot's web app fell 46% from June to September 2026, and Perplexity fell 46% year over year.
Is ChatGPT losing market share? Not since May 2026. ChatGPT's worldwide web-visit share rose from 53.7% in May to 57.5% in September 2026 after falling from 79.0% in May 2025.
Is the AI chatbot market still growing? Year over year, yes: the seven assistants' combined web visits rose 30% to 10.29 billion in September 2026. Month to month, the total has held between 9.8 billion and 10.4 billion since March 2026.
How many people use ChatGPT? OpenAI reported 1.2 billion weekly ChatGPT users at its DevDay on September 29, 2026. Similarweb counted 492.6 million monthly unique visitors to chatgpt.com in September 2026, web only.
How many people use Gemini? Alphabet reported 950 million monthly active users for the Gemini app on July 22, 2026. Similarweb counted 313.1 million monthly unique visitors to gemini.google.com in September 2026, web only.
What is ChatGPT's market share in the United States? ChatGPT held 63.5% of US AI chatbot web-visit share in September 2026, ahead of Gemini (17.4%) and Claude (13.2%).
Which AI chatbot is most used in the United States? ChatGPT is the most-used AI chatbot in the United States, with 1.16 billion US web visits in September 2026 and a 63.5% share.
Which AI chatbot is most popular in India? ChatGPT, with 64.1% of the seven assistants' web visits in India in September 2026, followed by Gemini (20.2%) and Claude (11.7%).
Which AI chatbot is most popular in Europe? ChatGPT leads in the United Kingdom (68.2%), Germany (62.6%), France (62.5%), and Spain (55.0%), while Gemini leads in Italy (44.8% to ChatGPT's 43.5%), based on September 2026 web visits.
Which AI chatbot is most popular in Japan? ChatGPT, with 55.6% of the seven assistants' web visits in Japan in September 2026, followed by Gemini at 35.5%, one of Gemini's strongest showings.
Which AI chatbot is most popular in the United Kingdom? ChatGPT, with 68.2% of the seven assistants' web visits in the UK in September 2026, its widest lead in any country in this report, followed by Gemini (14.3%) and Claude (13.0%).
Which AI chatbot is most popular in Brazil? ChatGPT, with 65.1% of the seven assistants' web visits in Brazil in September 2026, followed by Gemini at 26.3%.
Which AI chatbot is most popular in Australia? ChatGPT, with 66.6% of the seven assistants' web visits in Australia in September 2026. Claude is second at 15.5%, ahead of Gemini at 12.5%.
Which AI chatbot is most popular in China? Among these seven assistants, DeepSeek leads in China with 73.2% of web visits in September 2026. Domestic Chinese assistants such as Doubao are not in the set and are larger there.
Where is Claude most popular? The United States supplies 23.7% of Claude's web visits, followed by India (10.4%). By share of each country's AI chatbot visits, Claude is strongest in Australia (15.5%) and the United Kingdom (13.0%).
Is DeepSeek popular outside China? DeepSeek's largest market after China is Russia, where it holds 32.1% of the seven assistants' web visits. In the United States, its share is 1.1%.
Why does Statcounter show ChatGPT at 80%? Statcounter's AI chatbot figure (80.48% for ChatGPT in September 2026) is built from data collected on member websites and appears to track referrals from assistants to other websites, not usage of the assistants. This report measures visits to the assistants themselves, where ChatGPT's share is 57.5%.
Which AI model is the most capable in 2026? No like-for-like answer is available for the September 2026 flagships, because GPT-6, Claude Opus 5.5, Gemini 4 Argon, and Grok 4.7 launched without published GPQA Diamond or SWE-bench Verified scores. Among earlier models with published scores, Gemini 3.1 Pro leads GPQA Diamond at 94.3% and GPT-5.5 leads SWE-bench Verified at 88.7%.
Which AI chatbot has the cheapest flagship model? DeepSeek V4 Pro lists at $1.74 input and $3.48 output per million tokens, the lowest of the five makers' flagships in October 2026, followed by Grok 4.7 at $2 and $6.
How often is this report updated? Monthly, using the latest complete month of Similarweb data. The October 2026 edition uses September 2026 data plus an early-October reading.
Methodology and data sources
- Metric: web visits (a session on the assistant's primary web domain) and web-visit share within this defined group of seven assistants.
- Data source: Similarweb, total = desktop and mobile web, pulled October 20, 2026. Frontier-model data from the DemandSphere AI Frontier Model Tracker, used with permission (updated October 19, 2026). Company-reported user figures from OpenAI's DevDay 2026 recap and Alphabet's Q2 2026 earnings remarks. Statcounter figure from its AI chatbot market share page, September 2026.
- Data window: September 2026 (latest complete month). Monthly trend July 2025 to September 2026; February and May 2025 trend columns from earlier editions. Early-October reading uses daily data for October 1 to 11, 2026, compared with September 3 to 13.
- Comparisons: month-over-month vs August 2026; quarterly vs June 2026; six-month vs March 2026; year-over-year vs September 2025.
- Scope of data: worldwide ranking, United States ranking, 15-month monthly trend, combined market size, 18-country share table, top countries for all seven assistants, unique visitors, engagement, a US platform breakdown of web versus app users (May 2026, the latest available), and a frontier-model price comparison.
- Inclusion rule: standalone, general-purpose generative AI assistants on a separable primary web domain above roughly 50 million monthly web visits.
- Excluded apps: assistants without a separable domain (Meta AI), companion and character apps (Character.AI), aggregators (Poe), major Chinese-language assistants (Doubao, Ernie, Qwen), and small standalone apps.
- Known limits: web visits exclude native apps, embedded surfaces, and API or enterprise usage; some assistants' web visits can be raised by ecosystem entry points; the platform and model tables use different metrics and dates from the web-visit ranking; estimates are panel-modeled, carry error bands, and are revised monthly.
- Update cadence: monthly.