
If you followed our GA4 setup guide, your GA4 property is probably already tracking one or more events that qualify as conversion events. This article covers:
- What conversion events are
- How to create, modify & remove conversion events in GA4
- Choosing how conversion events are counted
- Using the conversion event report in GA4
- Making Looker Studio charts with one or more conversion events
- Analyzing & applying conversion event data
Conversions & Events in GA4
GA4 treats everything as an event:
- a user entering a the website = session_start
- a user viewing a page = page_view
- a user clicking on a link = click
Here’s a list of automatically collected events in GA4. You can use Google Tag Manager (GTM) to create even more GA4 events to track.
GA4 Events vs Conversions
Events in GA4 are used to analyze user behavior on your website, but conversion events are used to measure achievements.
A conversion event can be any user action you think is important to your business. These important events were called goals in UA and they’re called conversions in GA4. You get to decide which events are labeled conversion events, whether they’re automatically tracked or events that you created.
Think of conversions as signs of a successful website session. What do you want users to do on your website?
Examples of common GA4 conversion events include:
- Contact form submission
- RFQ form submission
- Click to call
- Book an appointment
- Make a purchase
- View or download a PDF (or other asset)
- Scroll all the way to the bottom of a page
- Sign up for a newsletter
In Universal Analytics (UA) you’re limited to 20 goals/events. If you want to track more than 20 you have to create a separate view. In GA4 you can track as many events and conversion events as you want.
<blockquote class="quote">Unlimited event and conversion tracking is just one of several ways that GA4 is better than UA.</blockquote>
Set Up Conversion Events in GA4
Marking an existing GA4 event as a conversion is super easy.
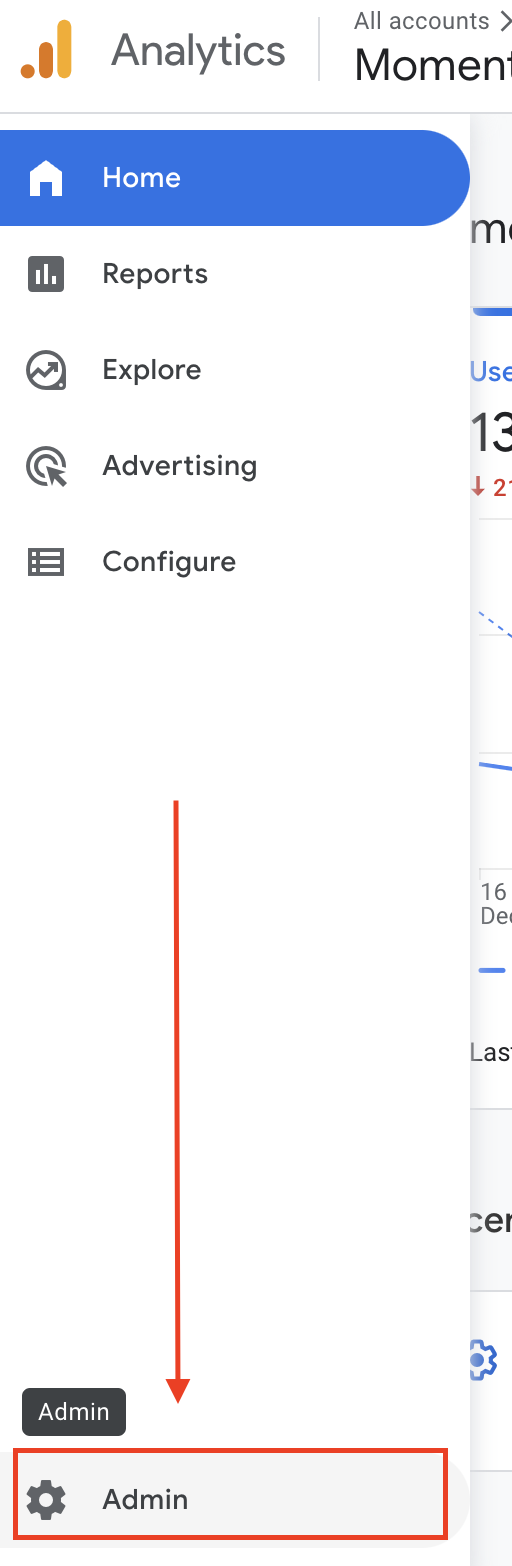
Click Admin (gear wheel) in the left nav at the bottom:
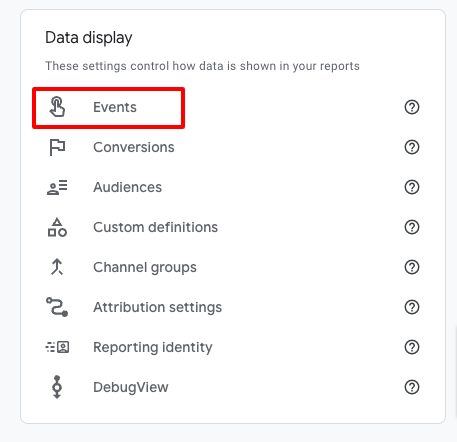
Click Events in the Data display card:
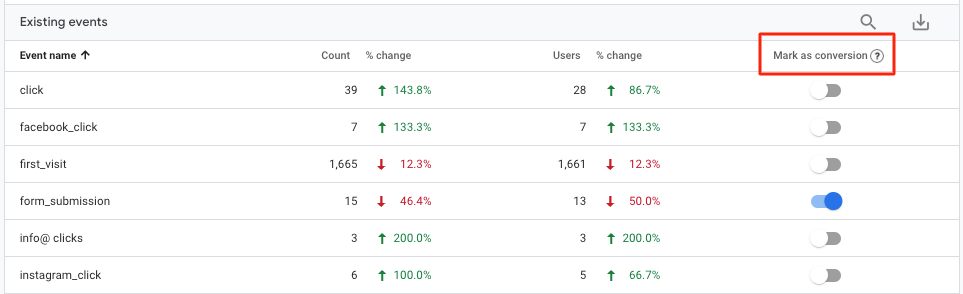
Click the toggle button on the right to mark any event as a conversion:
After you mark an event as a conversion, it can take up to 24 hours to appear in GA4 detail reports (realtime reports may update faster). If you don’t want to wait 24 hours for the data, there’s an extra step to take:
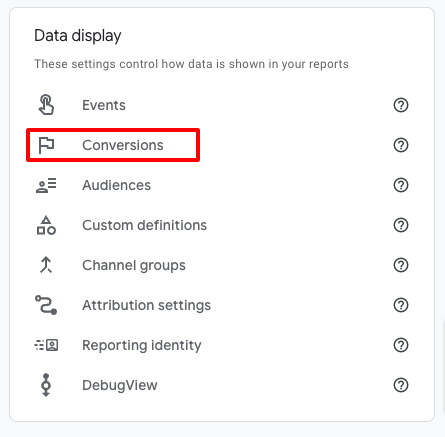
Go back to Admin. Now click Conversions in the Data display card:
Click New conversion event (blue button). A new panel will appear.
In the New event name field, enter your new conversion event name exactly the same way it appears on the Events page. Click Save. You’re all set!
The Conversions page in the Admin area shows you how many conversion events were tracked for the current date range. But you can get more insights into conversion events using other GA4 reports.
Edit Conversion Events in GA4
There are two different ways to edit conversion events in GA4, depending on whether it’s a custom event (that you created) or an automatically-tracked event built into GA4.
Edit Custom Conversion Events
To modify an existing conversion event that you created, go to Admin > Data display > Events.
Click Modify event (blue button). A new panel will appear with a list of all your custom events.
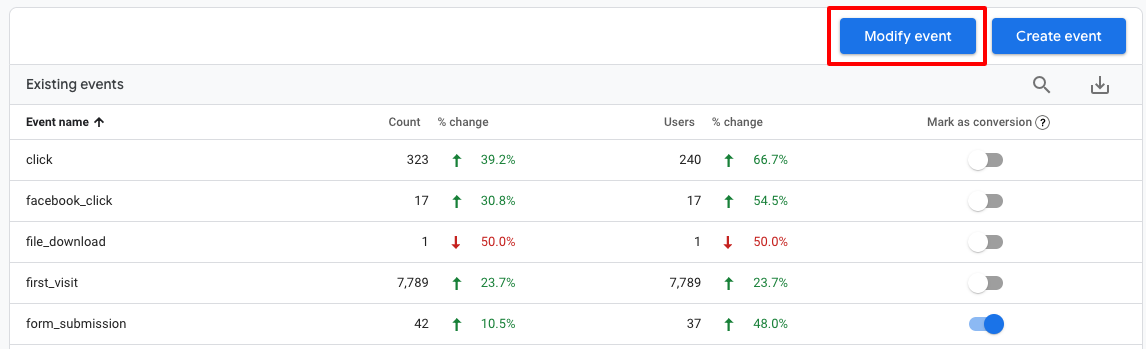
All conversion events start as events, so editing a conversion means editing the event setup
Click the custom event you want to modify.
A new Configuration panel will appear.
Edit the event name, conditions and parameter configuration as desired, then click Save (upper right).
<div class="post-alert">Event modifications do not apply to past data, they only change data collection going forward. It may take an hour or more for your modifications to take effect.</div>
Edit Built-in GA4 Events
To modify an automatically-tracked GA4 event (an event provided by Google that you did not create), go to Admin > Data display > Events.
Click Modify event. A new panel appears. Click Create.
Enter a descriptive name in the Modification name field.
Use the Matching conditions to specify how you want to modify an existing event.
Add, remove or Modify parameters as desired.
Click Create.
Now you have a saved event modification. Event modifications apply to GA4 data in the order they are listed, which might be significant depending on how many event modifications you’ve made, and in what order.
If you have more than one event modification saved, you can reorder them by clicking Modify event > Reorder, then drag and drop them into the order you want.
<div class="post-alert">You probably don’t want to modify the automatically tracked GA4 events, especially fundamental ones like page_view. In most cases you’re better off creating a new custom event rather than modifying an existing one.</div>
Delete Conversion Events in GA4
You can’t delete a conversion event, you can only turn it off.
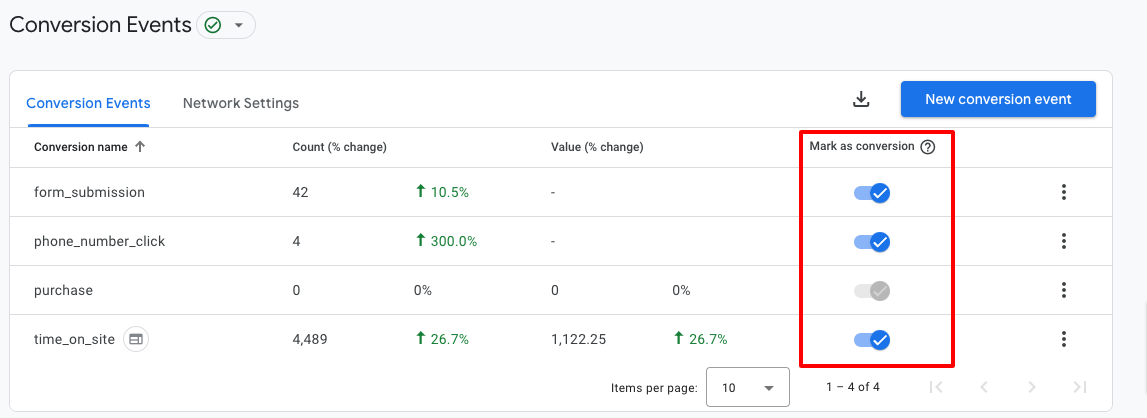
Go to Admin > Data display > Conversions
Un-toggle the Mark as conversion toggle button for any conversion you want to remove:
If you want to truly delete an event from GA4, you have to do it in two steps.
Start in Admin > Data collection and modification > Data deletion requests
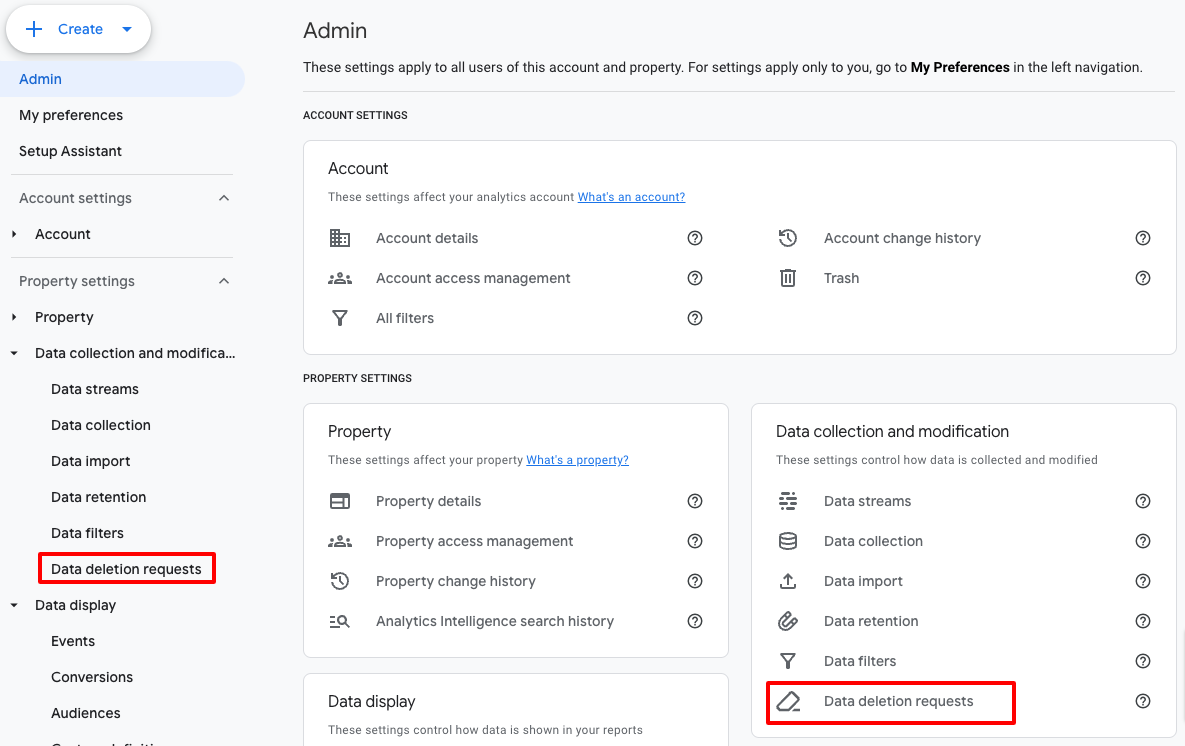
From there, follow the steps in this really helpful Measurelab article. But before you go ahead and delete a GA4 event, be aware that it will still be visible in reports looking at historical data—it will show up as (data deleted) instead of the former event name.
So if your goal is to clean up a report view or Looker Studio dashboard, you’ll still have to manually filter something out.
GA4 Conversion Counting Methods
In Universal Analytics, goals were only counted once per session. A user could complete multiple goals in a single session (e.g. submit multiple forms, or click the call button multiple times), but only one goal would be counted.
In Google Analytics 4, you can choose whether conversions are counted once per session or once per event. If you choose once per event, GA4 will count every single conversion event no matter how many happen in the same session from the same user.
Google recommends the once per event setting, but it may or may not be an ideal counting method, depending on how your conversions are set up.
For example, let’s say you have a conversion event that tracks form submissions based on views of the thank-you page. A user submits a form, views the thank-you page, and then navigates to another tab in their browser or a different app in their phone. Later they reopen that browser tab or app, and a second view of the thank-you page is tracked. If you’re tracking that conversion once per session, only one form submit was counted. But if you’re tracking it once per event, a second conversion was just counted.
On the other hand, if you have a conversion event that’s tracking resource downloads, page scroll or some other action that users might do multiple times in a session, then once per event would be more helpful.
The good news is you can specify the counting method for each individual conversion event.
Default Conversion Event Counting Method
In GA4, the default counting method depends on how your conversion events were created.
Once per event is the default if:
- You created conversion events yourself
Once per session is the default if:
- You used the goals migration tool in the GA Setup Assistant after April 2023
- Your GA4 property was automatically created by Google
Not sure? No worries: you can easily see and change which counting method is being used for a conversion event.
View or Change Conversion Counting Method
Go to your Conversion Events table: Admin > Data display > Conversions.
Click the three dots to the right of a conversion event.
Click Change counting method.

Select Once per event or Once per session. Click Save.
You can change the counting method for a conversion event anytime.
<div class="post-alert">Changing the counting method will only change how conversions are counted going forward—it won’t affect past data. Be aware that changing the counting method could skew conversion data comparisons.</div>
Use & Customize the Conversions Report
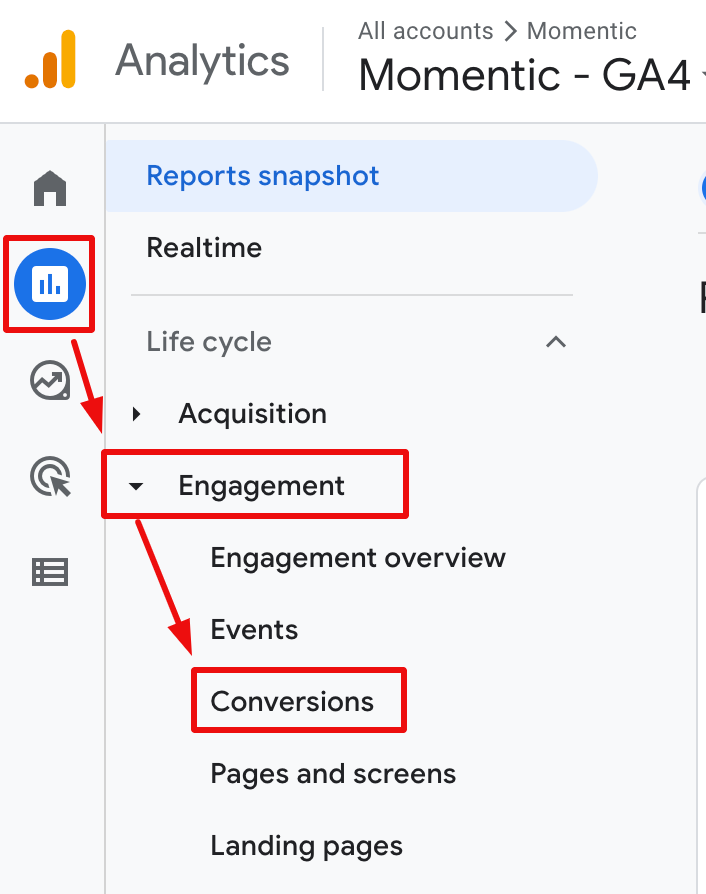
There’s a built-in conversion events report in GA4. Find it under Reports > Engagement > Conversions:
Here are some helpful ways to look at your conversion event data:
- Which page a user was on when they converted
- Which landing page a converting user entered the site on
- Traffic sources (organic, paid, social, etc) of converting users
Let's learn how to find each type of data, and then we'll go over how to use that data to inform your SEO strategy.
Dimensions in the GA4 Conversions Report
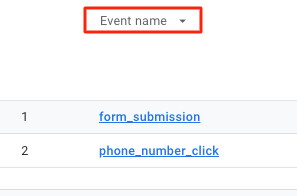
The default dimension in the Conversions report is Event name. To see which page a user was on when they triggered a conversion event, click the little arrow next to Event name and choose Page path and screen class from the dimension picker.
<div class="post-note">Page path (aka slug) means the part of the URL after the domain, for example: /blog/ga4-conversion-events
Screen class is only used for mobile apps. If you only have a website and not a mobile app, you won’t see any screen class info, so don’t worry about it. GA4 is designed to incorporate data from both websites and mobile apps, so that’s why screen class is included.</div>
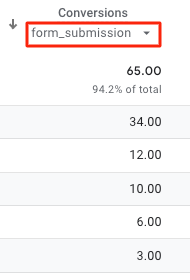
Now you can see the pages users were on when they completed any conversion event. To narrow it down to a specific conversion event, click the arrow next to All events under the Conversions column header, and pick the one you want.

Use the drop-down menus or add a secondary dimension (plus sign) to drill down into conversion data.
In the Conversions metric column header, ‘All events’ will be replaced by the name of the conversion you select:
You can select different dimensions to see more information:
- Page location: full page URL instead of just the slug
- Page title: page title instead of URL or slug
- Page referrer: which page the user was on before they arrived on the page where they converted (could be internal or external)
- Landing page: which page the user entered your site on before converting (You can also see this in a landing page report.)
You can add more dimensions by customizing your Conversions report, then choose the you want from dropdown menu.
Finding the Traffic Source of Converting Users
To see traffic sources for a specific conversion event, change the dimension back to Event name:
Click on one of the conversion event names. The next screen shows you the traffic source breakdown, with Default channel grouping as the default. You can use the dimension dropdown to select Source, Medium, or Campaign instead:

- Source: the domain the user was on before clicking through to your website
- Medium: organic, direct (none)*, referral, and cpc
- Campaign: organic, direct, directory, referral, and any paid campaigns you have
*Direct/None in GA4 means there aren’t any defined Google Tracking URL parameters, so Google doesn’t know where those users came from. For example:
- Using a bookmarked link
- Clicking a link in a PDF or email
- Clicking a link in a project management app
- Typing the domain name into the browser
You can reduce the amount of traffic that ends up in the Direct/None bucket by adding a UTM parameter when you link to your website from a PDF, email signature, Google Doc, etc—but that’s a topic for a different blog.
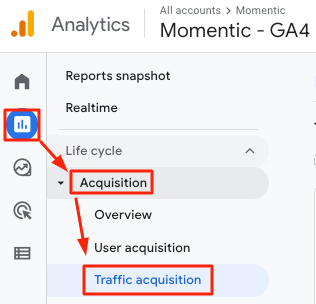
What if you want to look at the traffic source for all your conversion events instead of one at a time? Then you have to use the Traffic acquisition report: Reports > Acquisition > Traffic acquisition
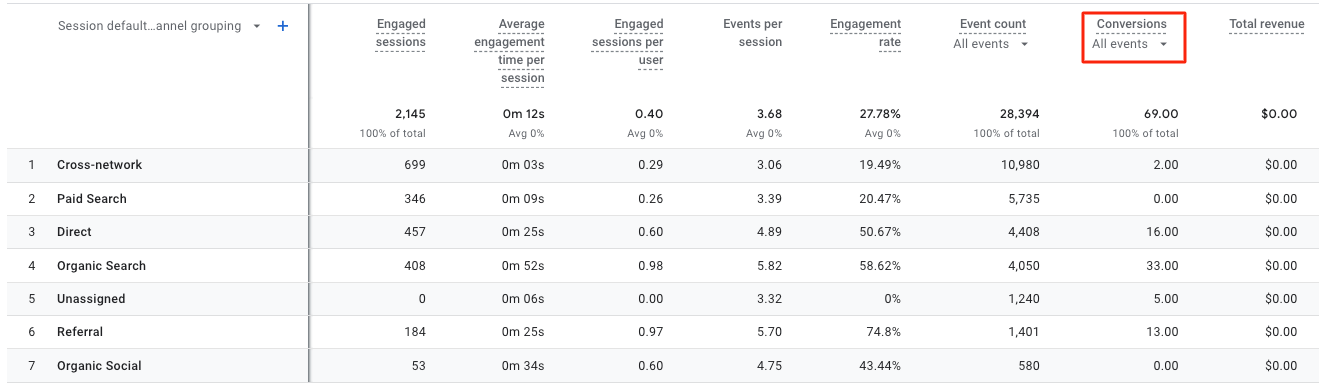
This report shows you the traffic sources bringing the most users to your website with a variety of metrics. Scroll right to find Conversions:
Click the pencil icon in the upper right to customize this report. Then click Metrics. You can drag and drop the metrics (column headers) to re-order them, and you can also remove/add metrics as desired.
Click Apply at the bottom when you’re done, and you’ll see the changes in the report table.
Click Save if you want this report to look the same way the next time. You have the option to save your changes to the current report, or save it as a new report. Be aware that saving changes to the current report is a permanent change for everyone who uses this GA4 property.
GA4 Conversion Events in Looker Studio
When it comes to reporting on GA4 conversion events in Looker Studio (formerly Data Studio) it's not as straightforward as it is with UA, but it's easy once you know the steps.
Here's how to visualize GA4 conversion events in a Looker Studio time series chart:
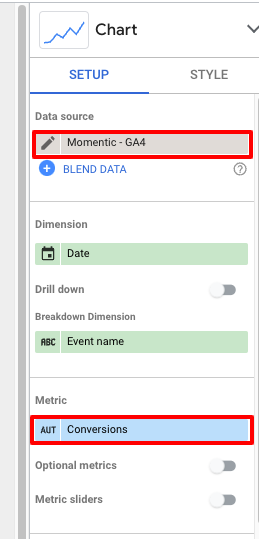
Connect GA4 as your data source for the report. The default dimension is Date and the default Breakdown Dimension is Event name.
Choose Conversions as the metric. If you stop here, it will show you the total of all your GA4 conversion events added together.
To only see one or more specific conversion events, scroll down to the bottom of the Setup menu and click Add a Filter.
Use Event name to specify which conversion events you want to include (or exclude).

Click AND to add more rows until you’ve filtered for all the conversion events you want to see or hide in your chart. Then click Save (blue button, lower right).
Remember to give your filter a descriptive name so you can easily find it again. You can use the conversions metric with event name filters to visualize any combination of GA4 conversions in the Looker Studio chart style of your choice.
Using Conversion Event Data
Now that you know where to find GA4 conversion event data, you can use it to create or refine your digital marketing strategy.
Which page users are on when they convert
It’s helpful to know which pages have a strong conversion rate after a user entered on a different page (often the homepage). You can look for ways to:
- Regularly update converting pages to make them an even better resource
- Optimize UX to encourage more conversions
- Promote them on your socials
- Make sure site visitors can easily find them from the navigation or helpful interlinking
If you are planning to add more pages to your website, you can look at your top converting pages and include successful elements from them such as:
- Page layout
- Call to action
- Social proof
- Images
- Video
Remember to review your top converting pages on multiple devices, and only replicate elements from them if they’re relevant to the new pages you’re creating. Always prioritize what’s most helpful for site users.
Your top converting landing pages
When you know which landing pages have the best conversion rate, you should look for opportunities to make them perform even better, or opportunities to create the same type of page for another topic. You’ll get more return on your efforts by leveraging something that’s already working.
If you created a landing page to get users to perform a specific action (fill out a form, download a rate sheet, sign up for your newsletter) but the data shows a low conversion rate, you need to diagnose the issue: is the page not getting enough entrances, or are there plenty of users visiting the page and they’re just not converting?
From there you can make additional optimizations (and maybe fixes) to help boost the conversion rate.
Traffic sources of converting users
When you understand which traffic sources are sending the most users and generating the most conversions, you can allocate your marketing resources more effectively.
For example, if you’ve been investing in paid search or social media marketing campaigns but most of your conversions are coming from organic search traffic, you may want to rethink how your marketing dollars are allocated.
<div class="post-note-cute">This article was intended to cover the basics of GA4 conversion events and the most common questions people have - if you have a question about GA4 events or anything Analytics-related, don’t hesitate to reach out: <a href="mailto:[email protected]">[email protected]</a></div>
Resources used to create this article:
[GA4] About Google Analytics conversions (Google documentation)
[GA4] Create or modify conversion events (Google documentation)
[GA4] Modify and create events in Analytics (Google documentation)
[GA4] Report on conversions (Google documentation)
[GA4] About conversion counting method (Google documentation)
How to delete events in Google Analytics 4 (Measurelab)

