
<div class="post-alert">Update: GA4 now includes its own built-in landing page report. The original content in this post - How to create a landing page report in GA4 - is still available below this updated section.</div>
You can find the new Landing page report under Reports > Engagement > Landing page
.png)
Fresh out of the box, the metrics for the new landing page report (left to right) are:
- Views
- New users
- Average engagement time per session
- Conversions
- Total revenue
Like all GA4 reports, you can customize the landing page report to show the metrics you care about. A couple things to consider:
If you don’t have an ecommerce site, Total revenue is moot. Go ahead and remove that metric or replace it with one you care about.
Views are not entrances. Views are pageviews, no matter which page the user entered the site on. Entrances aren't available as a metric in any built-in GA4 reports. So far you can only find Entrances as a metric in Explorations (more on that below).
Learn more about Views and Sessions in GA4, and how they can guide SEO strategy.
Entrances Workaround for GA4 Landing Pages Report
You can use GA4's automatically tracked session_start event as a stand-in for entrances.
Click the pencil icon <span class="material-symbols-outlined">edit</span> to customize the report.
Click Metrics.
Click Add metric. Select Event count.
Drag “Event Count” to the top of the list.
Apply and Save.
Now go back to the report.
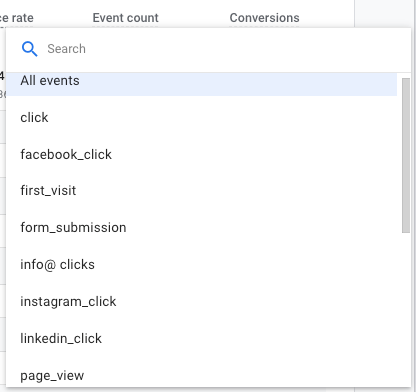
Click the ‘All events’ dropdown under the Event Count column.
Select session_start

Now you can get an idea of how many entrances each landing page got. The session_start event count is often an exact match or at least pretty darn close to the session count for each landing page. So if you’re really in a hurry you can just look at sessions.
There's a whole Analytics Help page about entrances & exits. It talks about landing pages but doesn’t explain why entrances aren’t an available metric for the landing page report.
It does say that "Entrances and Exits metrics are currently only available in Explorations." This gives me hope that Entrances might be available as a metric for GA4 reports in the future. Cross your fingers!
GA4 Landing Page Report vs. UA Landing Pages Report
If you compare your GA4 Landing pages report to your UA Landing Pages report for the same time period, you won't see the same number of sessions, because session counts in GA4 and UA are different.

It's the same if you look at the All Pages report in UA sort by Entrances: the entrances for each URL are the same as sessions in the Landing Pages report - and neither of them match the session_start event count in GA4.
GA4's Landing Pages report also has some advantages over the UA Landing Pages report:
- More metrics available
- Ability to re-order metrics
- You can customize & save multiple versions of a landing page report
- Better UX when choosing primary or secondary dimensions
- Visualize data as a line chart or bar chart (UA offers line chart only)
Landing Page Entrances in GA4 Explorations
If you want to report on Entrances as a metric, here's how you can do that in GA4:
<div class="post-action">Click Explore from the left-hand menu, and click Blank to create a new Exploration.</div>

In the upper left under Variables, give it a name (for example “Landing pages with entrances”).
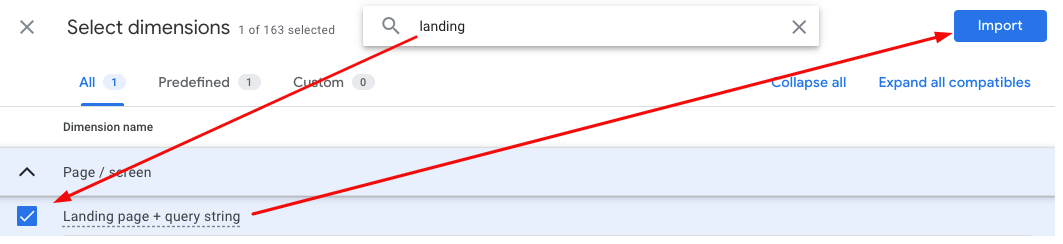
<div class="post-action">Click the plus sign next to Dimensions. Type landing page in the search bar of the new window that opens on the right. At the time of publishing, there’s only one option: Landing page + query string. Check the box next to it and click “Import” in the upper right corner.</div>
<div class="post-action">Click the plus sign next to Metrics. Type entrances in the search bar. Check the box and click “Import.”</div>
Add other metrics if desired.
<div class="post-action">Double click the dimension and metrics you added. This makes them show up in the reporting field on the right.</div>
Using the other variables and settings on the left, you can change the date range, add a segment (like organic traffic) or see your data as a chart instead of a table.
Filtering for just organic traffic isn’t super obvious, so we’ll go over that one quick:
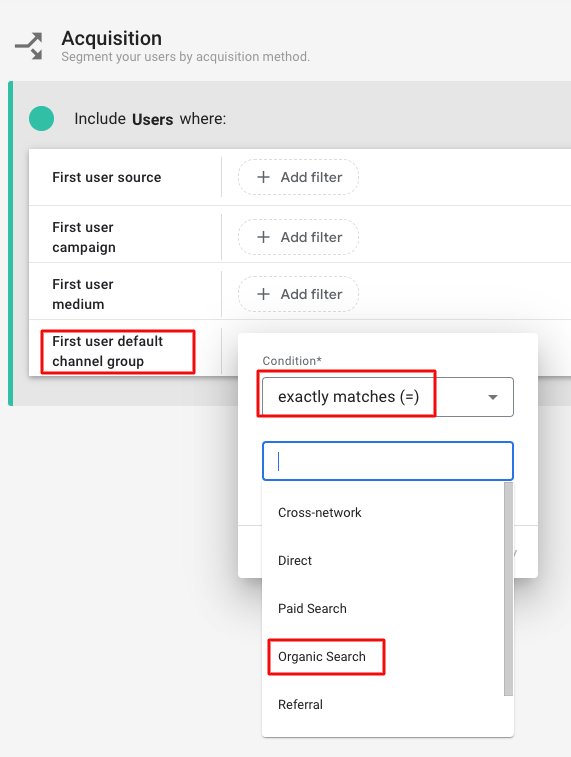
<div class="post-action">Click the plus sign next to Segments. In the lower section called “Suggested segments”, click “Templates” and then “Acquisition”.</div>

<div class="post-action">Under Acquisition, find “First user default channel group” and click “+Add filter”. Under Condition select exactly matches, then select Organic Search. Click Apply. Title the segment Organic Search (upper left) then click “Save & Apply” (upper right).</div>
There isn’t a “Save” button but the Exploration you just created will be saved. You can revisit and customize it as needed.
GA4 Landing Page Reporting in Looker Studio
Entrances isn’t available as a metric in Looker Studio at this time. With luck it will be one day, but in the meantime we can use the same session_start workaround.
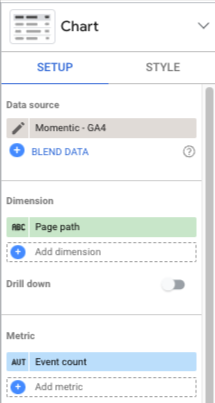
Start in Looker Studio. Make sure GA4 is your data source.
Create a new table.
Dimension = Page path
Metric = Event count
Next, scroll to the bottom of the Setup column and add this filter:
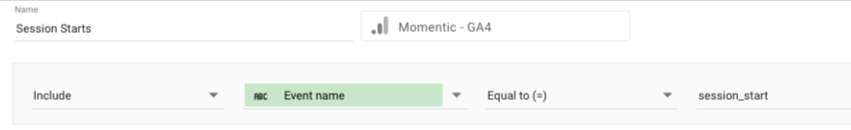
There you have it - a basic GA4 landing pages report in Looker Studio.
Options:
- Instead of Page path you could use Page title or Page URL as the dimension
- Add another filter to narrow down which landing pages you’re analyzing
- Edit the label of ‘Event count’ so it displays ‘Session starts’ or ‘Entrances’ instead
- Choose a different chart style, like a table with bars or a heatmap
Original Post on Creating a Landing Page Report in GA4
<div class="post-note">From this point down, the content is about how to create a GA4 landing page report as published on October 14, 2022 (just two months before GA4 announced the built-in version). It still has some good pointers about customizing reports, customizing the reports menu, and adding shortcuts to the reports snapshot page.</div>
The Landing Pages report in Universal Analytics (UA/GA3) is super helpful because it shows you which pages site visitors are entering on, how they found your site (traffic source) and how they behaved after entering (session length, events, conversions). Landing page reports help you identify the top-performing pages on your website, which is important for content strategy and prioritizing on-page optimizations.
There isn’t a built-in landing page report in GA4, but it’s pretty simple to set one up. This blog will walk you through it step by step. If you haven’t set up GA4 yet, there’s no time like the present!
Customize an Existing GA4 Report to View Landing Pages
Don’t worry: modifying reports won’t change how data is collected, only how it’s displayed.
<div class="post-alert">Important: If you share this GA4 account with other users, any changes you make to reports and summary cards will be made for everyone.</div>
Go to the Pages and screens report:
<div class="post-note">Reports (<span class="material-symbols-outlined">bar_chart</span>) > Engagement > Pages and screens</div>
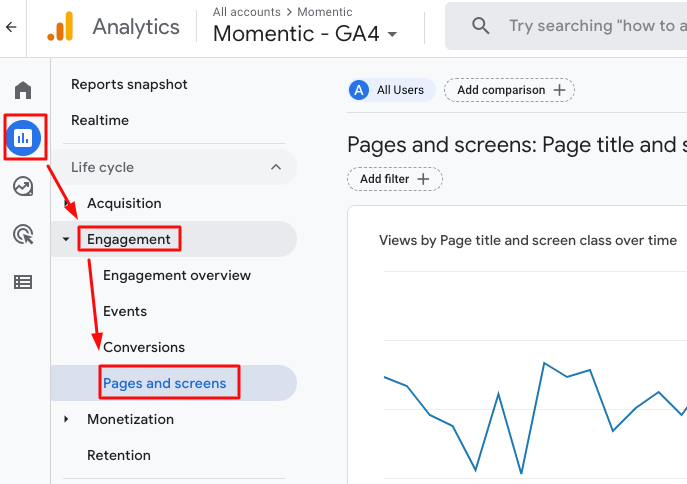
<div class="post-action">Click the pencil icon <span class="material-symbols-outlined">edit</span>in the upper right to customize it:</div>
A new menu appears on the right.
<div class="post-action">Click Dimensions, click Add dimension, and choose Landing page.</div>
<div class="post-action"> Click the three dots on the right of Landing page and choose <span class="material-symbols-outlined">widgets</span> Set as default.</div>
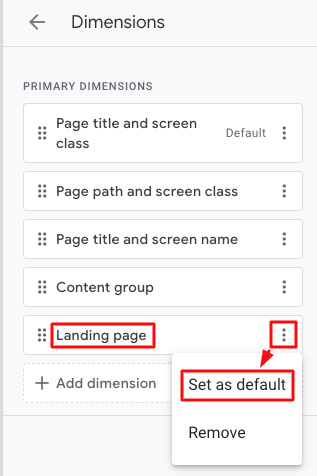
<div class="post-action">Click Apply in the bottom right corner.</div>
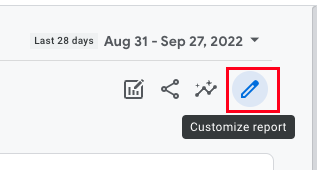
<div class="post-action">Click Save (to the right of the date range in the main report area). </div>
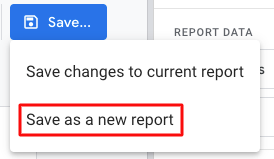
<div class="post-alert">Important: You should save this change as a new report called Landing Pages. If you save changes to the current report, you’ll lose the original Pages and screens report.</div>
<div class="post-action">Click Back in the upper left.</div>
<div class="post-action">Click Reports, then click Library.</div>
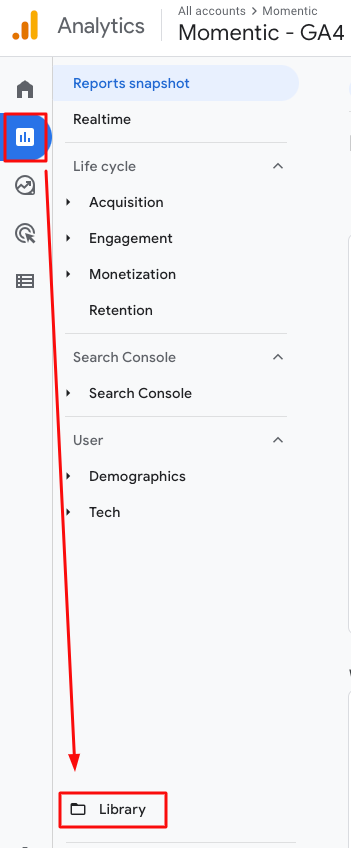
<div class="post-note">You need to choose a GA4 report collection where you want to add your new Landing Pages report. I think it makes sense to choose Life Cycle > Engagement alongside the Pages and screens report, but you can choose any collection.</div>
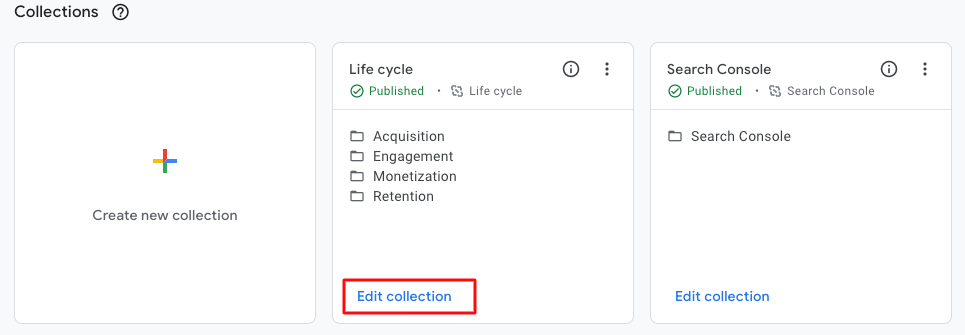
<div class="post-action">Click Edit collection.</div>
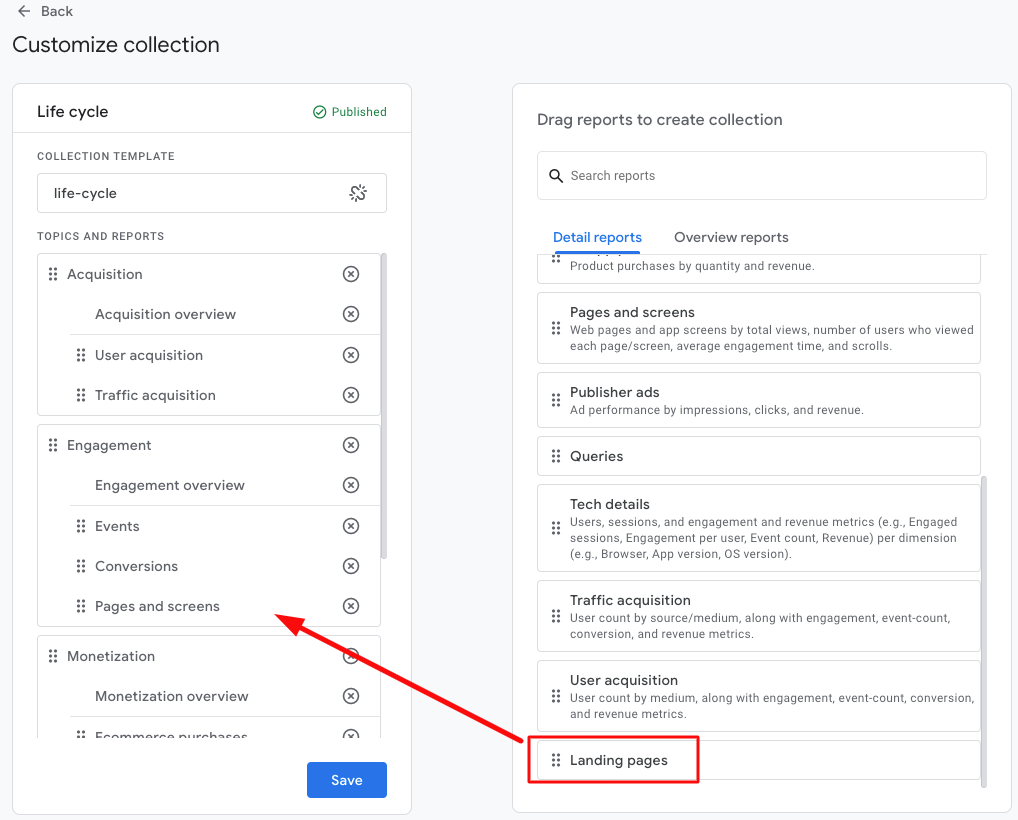
<div class="post-action">Scroll down to your new Landing Pages report. Drag and drop it into the section where you want it to live.</div>
<div class="post-action">Click Save.</div>
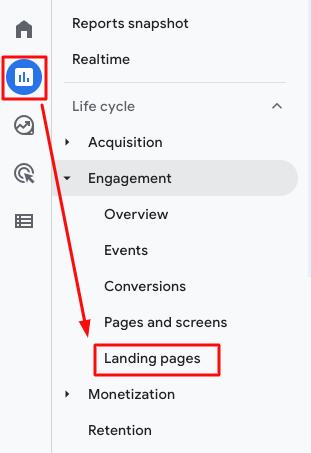
<div class="post-note">Now you can access the Landing pages report from the main nav under Reports:</div>
<div class="post-action">You can further customize your Landing pages report by <span class="material-symbols-outlined">mouse</span> clicking the pencil icon:</div>
- Add or remove Dimensions
- Add or remove Metrics
- Change the order of Metrics in the table by dragging/dropping them in the Customize menu
- Change chart types
- Hide charts
- Click the eyeball icon to hide/reveal
<div class="post-action">If you want to set it up as closely as possible to the UA Landing Pages report, choose these metrics and put them in this order:</div>
- Sessions
- First Visits (replaces % New Sessions)
- New Users
- Engagement Rate (replaces Pages/Session)
- Avg. engagement time (replaces Avg. Session duration)
- Events per session
- Conversions
<div class="post-alert">Important: Sessions in GA4 end after 30 minutes of inactivity. So each time a user interacts with the site it starts a new 30-minute countdown. This setting cannot be changed in GA4.</div>
Sessions in UA are also set by default to end after 30 minutes of inactivity. But UA lets you change the session timeout to anywhere between one minute and 4 hours:
Admin > Property > Tracking Info > Session Settings > Timeout Handling > Session timeout
So if you changed your session timeout in UA, your landing page report will be different in UA vs GA4.
Of course the beauty of being able to edit and save reports is that you can choose which metrics are shown, so don’t feel obligated to re-create UA reports line for line. Just keep what’s useful.
View Landing Pages by Traffic Type
In UA, if you want to see landing pages from organic search (or any other traffic channel) you’d go to Segments and swap “All Users” for “Organic Traffic.”
It’s very similar in GA4. Up above the report title there’s a small blue bubble for Segments:
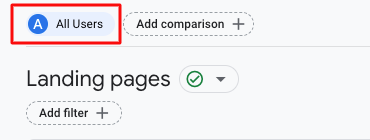
<div class="post-action">Click All Users. A new menu opens on the right. From the top dropdown, choose Session default channel grouping. From the second dropdown, click the box for Organic Search:</div>
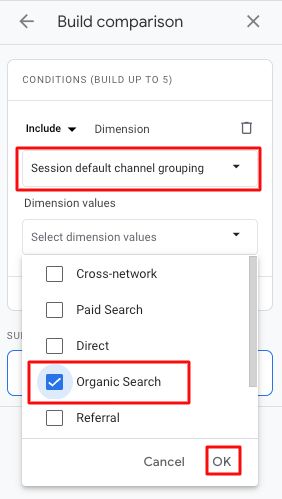
<div class="post-action">Click OK. Then click Apply in the bottom right. Now the Landing pages report is showing only organic traffic.</div>
In the second dropdown, you can select more than one type of traffic. But it will add them together in the report. This is fine if you want to look at the aggregate of Organic and Direct, or look at everything except Paid (for example). But what if you want to see two or more traffic types at the same time?
<div class="post-action">To do that, click on the Add comparison + bubble to add another segment:</div>
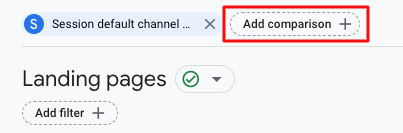
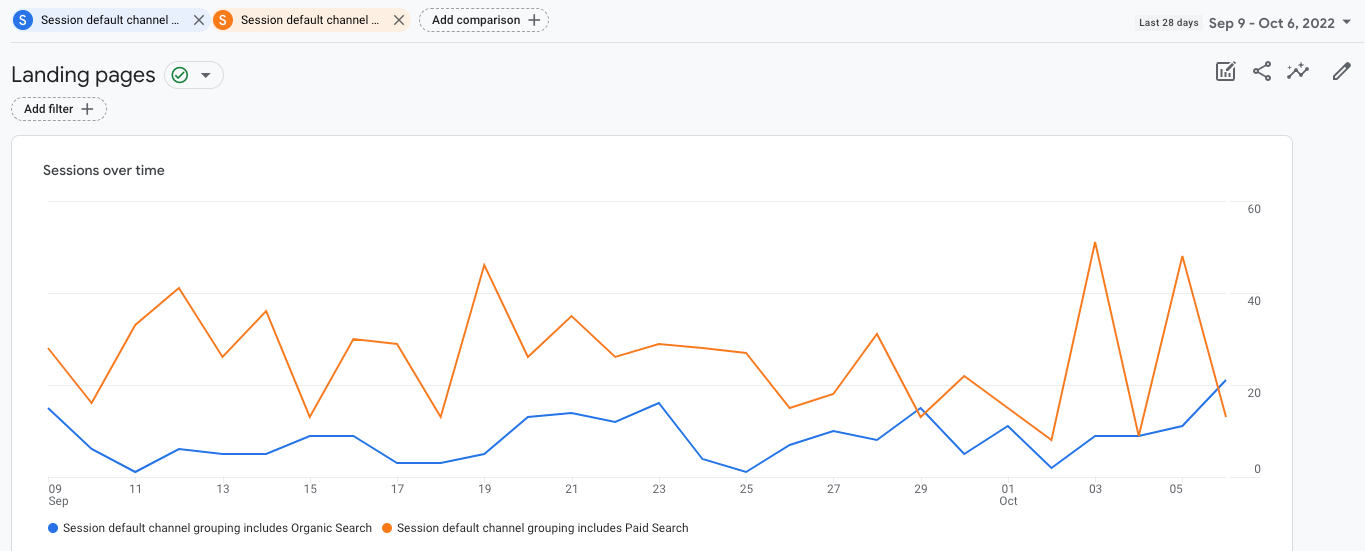
<div class="post-action">Same steps as before, but pick a different traffic type from the dropdown. Now you’ll see both of them in the report:</div>
GA4 segments behave like they do in UA:
- You can’t save a segmented view to a report, so you have to apply them anytime you want to see anything other than ‘All Users.’
- Segments you select stay active when you switch between reports.
This isn’t the exclusive way to make a landing page report in GA4 - I’ve read other blogs that customize the Traffic acquisition report as a starting point instead. You can choose whichever method makes more sense to you, or even make multiple landing page reports.
View Landing Pages by Revenue
You can use a landing page report to see which pages people enter on when they spend money on your website.
<div class="post-action">Click the pencil icon. Click Metrics. Choose the money-related metric(s) you want to analyze by landing page:</div>
- Repeat purchasers
- Add-to-carts
- Average daily revenue/purchases
- Checkouts
- Total revenue
- Transactions per purchaser
…there are plenty more to pick from. Apply the metric, save it, and you’ll see it as a column in your landing page report.
Sort Landing Pages by Metric
<div class="post-action">To sort landing pages by metric, hover over the space to the left of the column name. A light gray arrow appears. Click it and it turns dark gray. Now the table is sorted by that column:</div>
If you hover on the metric name instead, you’ll get a pop-up box with a definition.
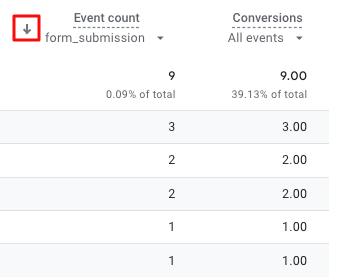
Metrics like Event count and Conversions also have a dropdown below them. You can choose to look only at a specific event or conversion event in your report.
Add a Shortcut to the Landing Page Report
You can add a snapshot of any report to your main reports page in GA4. These are called summary cards. Just like reports, you can customize the dimensions, metrics, and chart style.
<div class="post-action">To create a summary card for your Landing page report, click the pencil icon. At the bottom of the menu, click Create new card.</div>
A new window opens where you can customize the card:
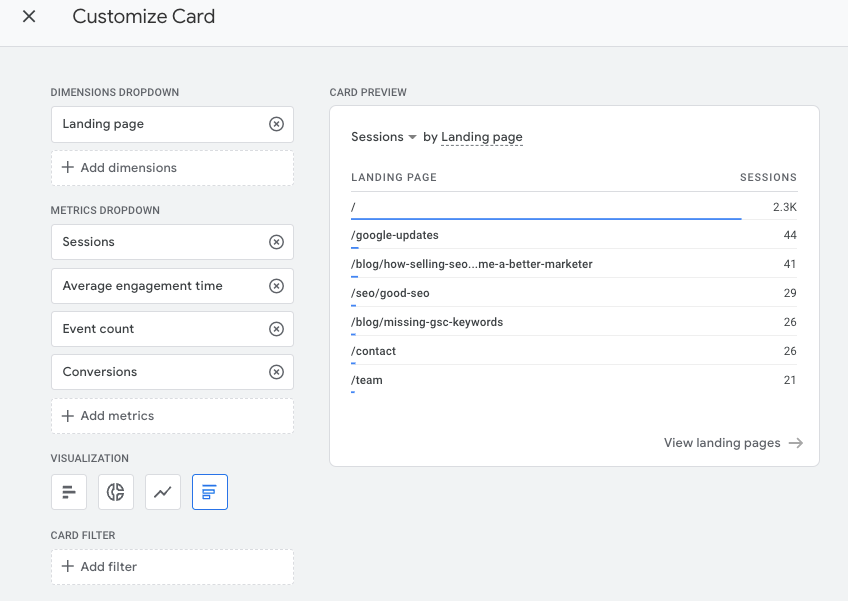
<div class="post-action">Play around with the options until you’re happy with how it looks (you can always change it later). Click Apply in the upper right corner, then click Save.</div>
<div class="post-action">Now click Reports in the main nav. It takes you to the Reports snapshot view.</div>
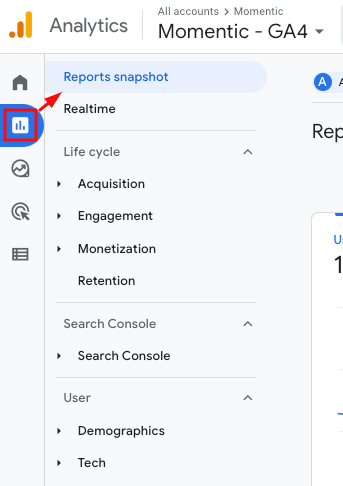
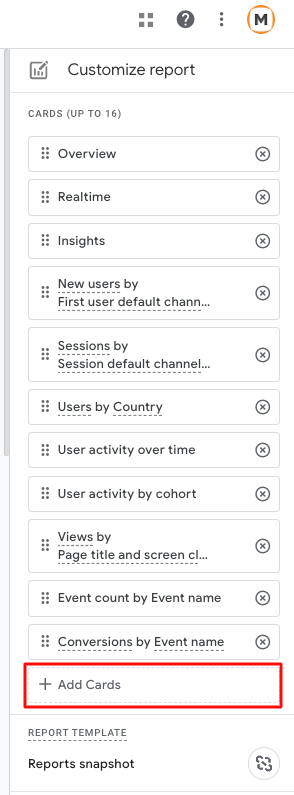
<div class="post-action">Click the pencil icon to customize your Reports snapshot page. Click the x to remove any card you’re not interested in. Click Add Cards to add the Landing page summary card you just made.</div>
<div class="post-action">Select the card you want to add, mouse click Add Card in the upper right.</div>
You can also change the order that summary cards display in your Reports snapshot by dragging and dropping them (just like the metrics when customizing a report).
<div class="post-action">When you’re finished, click Save. Now you can see a mini landing page report from the main Report page, and click through to see the full landing page report.</div>
.png)


