
Learning the ins and outs of GA4 can feel like a lot of work, especially if you’re constantly comparing it to Universal Analytics. It’s easy to get frustrated and wish Google Analytics hadn’t changed, but wishing won’t get those reports done! So let’s look forward not backward and celebrate some of the many ways GA4 is better than UA:
GA4 is better for user privacy
As data protection and privacy become more important, website analytics must evolve so we as digital marketers can keep using website performance data. GA4 offers features like IP anonymization, user consent management, and customizable cookie settings to help businesses comply with GDPR, as well as resources to help you understand how to implement best privacy practices.
GA4 automatically tracks a lot of events
GA4 automatically tracks outbound clicks, file downloads, scrolling, video engagement, site search data and more. GA4 can even automatically track form submissions in some cases.
GA4 makes it super easy to track conversions
It’s literally as easy as clicking a toggle button. Plus, GA4 allows unlimited conversion tracking (UA limited you to 20 conversions per reporting view). Learn more about GA4 conversion events and reporting.
GA4 includes more data
GA4 covers both website and mobile app data, unlike UA which only covered your website. GA4 also makes roll-up reporting and cross-device tracking easier and more accurate compared to UA.
GA4 lets you connect to BigQuery for free
Before GA4, you had to pay for GA 360 in order to connect to BigQuery, because it wasn’t possible with UA.
GA4 offers automated & custom insights
GA4 has a set of features called Analytics Intelligence that uses machine learning and configurable conditions to provide insights.
Automated insights look for unusual patterns and new trends, then bring them to your attention via:
- The integrated Insights dashboard (start on GA4 Home page, scroll down to Insights section)
- Insights Summary Cards on your Reports Snapshot & Advertising Snapshot reports
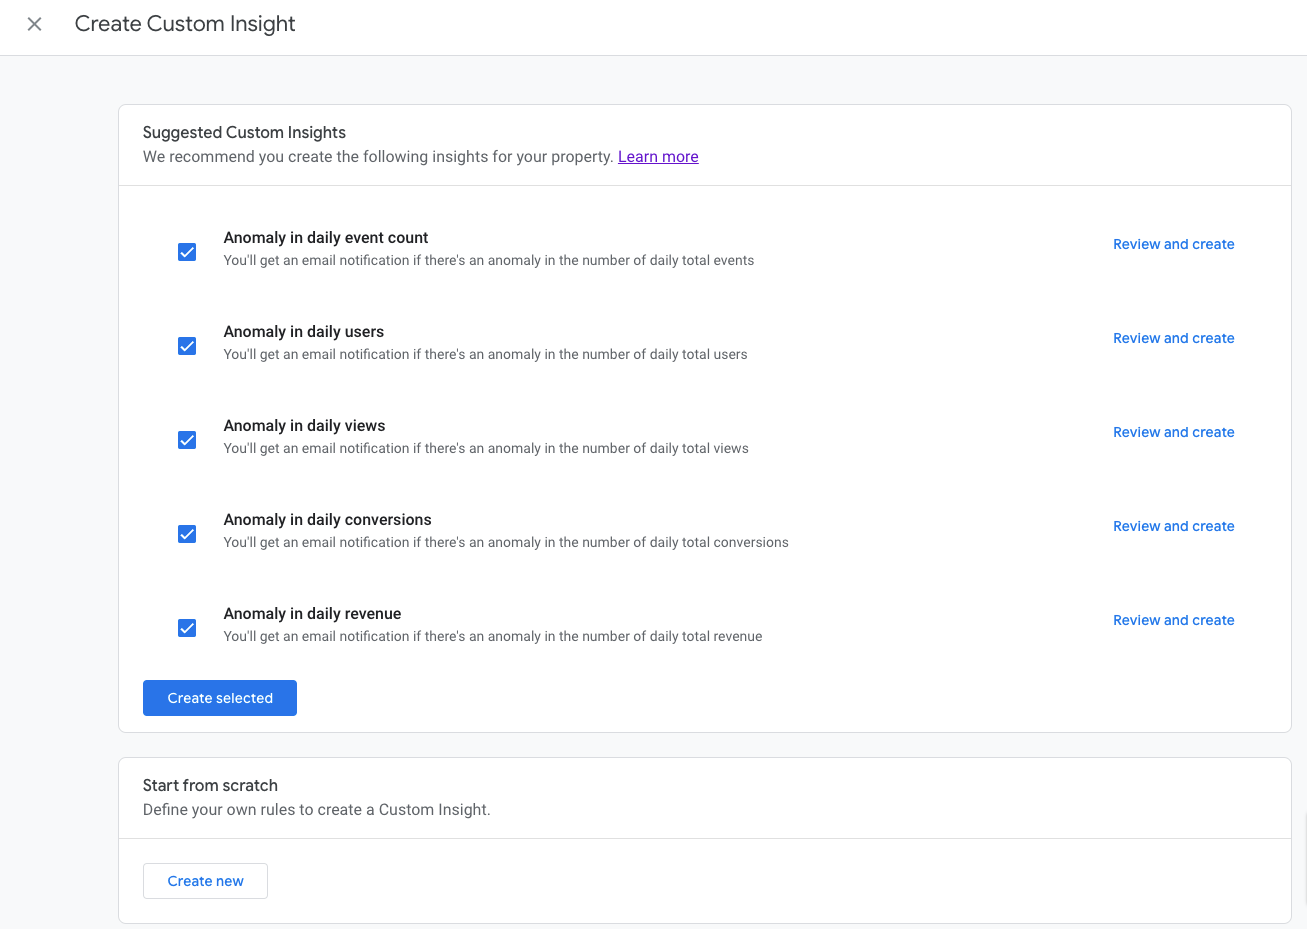
GA4 users can also create rules to generate custom insights:
- Click View all insights from the Insights dashboard or one of the Insights Summary Cards
- Click Create
- Edit a suggested insight or create your own from scratch
GA4 can send you email notifications about data anomalies
You can also manage email notifications for custom insights so you’ll automatically be notified when there’s an anomaly (or according to your specified conditions).
GA4 allows custom event parameters
When tracking UA events using GTM, there were only four event parameters you could use: two required (category, action) and two optional (label, value).
Because GA4 uses an event-based data model, event tracking is way more flexible! The event name is one parameter, and then you can add up to 25 custom parameters per event.
For example, you can add a custom event parameter for the device type, page title, page URL, button text, timestamp and more.
GA4 offers better report customization
A common complaint is that in GA4 it takes more clicks to see the report you want, because GA4 offers fewer premade reports than UA. This is mostly because where UA had more built-in reports based on the primary dimension, GA4 reports have a dimension picker.
Investing some time up front to customize GA4’s built-in detail reports can save you more time in the long run. (UA also let you create custom reports, but custom reports in GA4 are more versatile and user-friendly.)
Here are all the ways you can customize GA4 detail reports:
<div class="post-note">You need an account with Editor or Administrator permissions.</div>
Select/reorder dimensions & metrics
Start in any report by clicking the pencil icon in the upper right - this opens up the Report Builder panel:
- Click on Dimensions or Metrics. Dimensions are what you see in the far left data table dropdown. Metrics are what you see as column headers going across.
- Grab the 6 dots to re-order
- Click the 3 dots to set a dimension or metric as the default view (or remove it)
- Click the Add dimension/metric dropdown to search and select
- When you’ve got it set up how you want, click Apply in the bottom right
To save it as a new custom report, click the blue Save button (love the floppy disc icon) in the upper right of the report area. You can save your changes to the existing report, or save it as a new report and name it whatever you want.
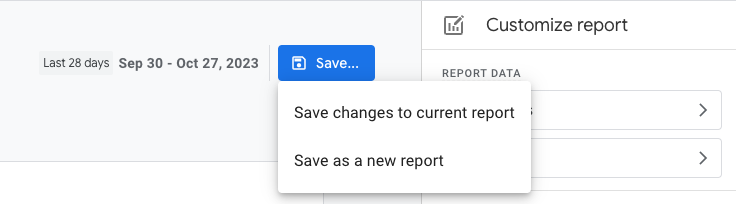
My advice is to save it as a new report, especially if you’re working in a client’s GA4 property. If you save changes to the current report it’ll change the default detail report permanently. If you don’t want to save any changes, click the Back button— it’s way over on the left above the report name.
Add a report filter
Adding a filter within the Report Builder works the same way as it does when you click the Add filter bubble under the report name. But you only have the option to save the filter if you’re customizing the report:
- Start in the Report Builder
- Below the Dimensions & Metrics editors, click Add filter
- Choose the Dimension from the dropdown
- Choose the Match Type from the next dropdown (including regex options)
- Choose the Value from the next dropdown
- Add another condition if you want (up to 5) & repeat the steps above
A Summary card shows you everything you’ve included in your filter as you work. Click Apply when you’re done, and click Save to create a customized report where you never have to set up this filter again!
Hide or edit charts
GA4 detail reports have a line chart and bar chart up top with a data table below, but this layout is customizable. Start in the Report Builder (click the pencil icon):
- Click the eyeball next to Line Chart or Bar Chart to hide/reveal
- Grab the 6 dots to change the order charts are displayed
- Click into a report type to pick a different one: Bar chart, Scatter chart, or Line chart
<div class="post-alert">Hiding or reordering charts happens instantly, so you can just click Save right after. To save a different chart type, you have to click Apply, then Save.</div>
Customize report summary cards
Report summary cards show up in overview reports. The overview report is the first item within each collection in the left-hand navigation pane:
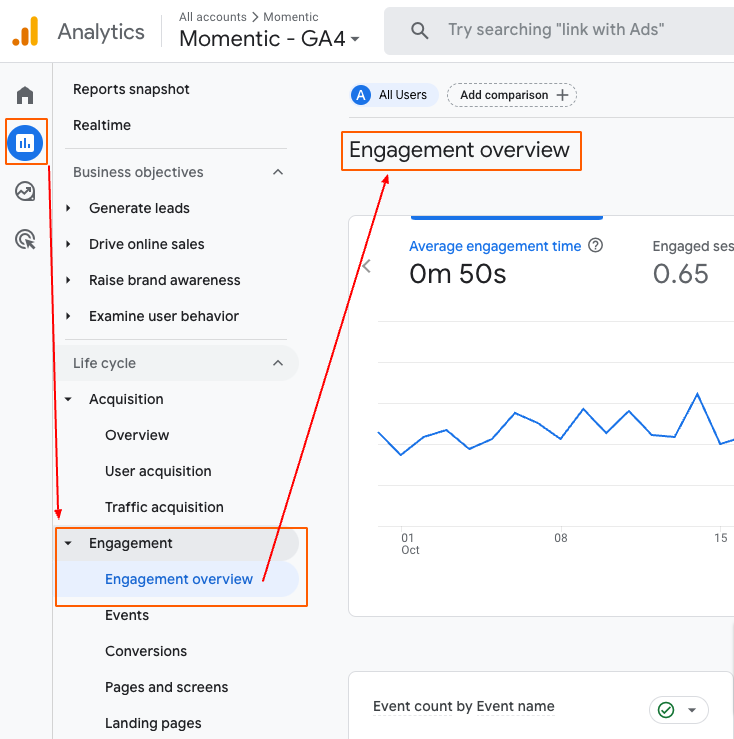
- Click the pencil icon, then look towards the bottom of the Report Builder where it says Summary Cards. Click the three dots to edit or delete the existing card, or click Create new card to add one.
- If editing or creating a card, a new Customize card section appears
- Edit & add dimensions, metrics & filter as needed
- Choose Table, Bar chart, Pie chart or Line chart as the visualization
Click Apply in the upper right, then click Save.
Create & customize overview reports
Not only can you create or customize individual overview reports, you can also customize GA4’s Reports snapshot: the overview of overviews.
Customizing an overview report is a lot like customizing a detail report, but even simpler:
- Click the pencil icon to open up the Report Builder
- Drag & drop summary cards to reorder them
- Click X to remove a card
- Click Add Cards to add more summary cards to the overview
There are so many options for adding more cards to an overview report: check out both Summary cards and Other cards to get the full picture. Summary cards belong to detail reports that are part of a collection, and Other cards belong to detail reports that aren’t part of a collection. They’re all fair game when customizing your overview report.
Customizing the Reports snapshot works the same way as customizing an Overview report.
<div class="post-note">Collections are the light gray unclickable names in the left-hand navigation pane: Business objectives, Life cycle, Search Console (if you linked Search Console to GA4), User, etc. Because you can create your own detail reports in GA4, not all reports belong to a collection.</div>
You can create new GA4 reports
If customizing an existing report won’t cut it, GA4 gives you the option to make your own detail reports from scratch. Here’s how:
- Click Library, which is all the way at the bottom in the left-hand navigation pane
- Click the blue Create new report button
- Choose to create a new overview or detail report
- Start from a template or a blank canvas
If you start from a template, it makes a copy of the existing detail report with the Report Builder already open. Then you just customize it and save.
If you start from a blank canvas you’ll see a standard detail report template with empty spaces where the charts and table go.
You can edit the GA4 report navigation
If you create a new detail or overview report it’ll only exist in the Library. If you want it to show up in the left-hand nav, you have to edit an existing collection, or create a new collection for it to live under.
It’s easy: when you’re in the Library, just click Create new collection or Edit collection, then drag and drop the reports you want in it (or remove ones you don’t). When creating a new collection, you have the option to start from a template or from scratch.
You can customize the GA4 report nav even if you haven’t made any new reports. Removing reports you never use (like getting rid of the Monetization report for non-ecommerce sites) will simplify the view and make room for new and custom reports you do use.

You can also remove entire collections, reorder collections in the report navigation, add new topics, and reorder/remove reports within existing topics.
There are a few limits to be aware of:
- Each GA4 property can have 7 report collections max
- Each collection can have 5 topics max
- Each topic can only have one overview report
- Each topic can have 10 detail reports max
You can create Explorations for even deeper reporting
GA4 has a brand-new element that never existed in UA: Exploration reports. This is a topic worthy of its own article (more likemultiple articles) but we’ll go over the basics and benefits here.
Exploration reports let you explore more granular data and apply advanced analysis techniques not available in standard reports.
For example, Entrances isn’t available as a metric in detail reports, but you can report on landing page entrances in Explorations. Exploration reports use raw event and user-level data, but standard GA4 reports use aggregated data (the trade-off is that exploration data is only retained for up to 14 months, while standard GA4 report data is retained indefinitely).
Here’s a brief intro to things you can do in explorations:
- Start an exploration from scratch or pick a template from the gallery
- Create a new exploration by duplicating one you made earlier
- Share an exploration only with users you choose (by default only the user who made an exploration can access it)
- Make segments & audiences (in addition to filters) and do segment comparisons
- Choose your visualization: Table, Donut chart, Line chart, Scatter plot, Bar chart or Geo map - and combine a chart & table in the same visualization
- Apply a heat map visualization to cells
- Easily export to Google Sheets, TSV, CSV or PDF
You can find Explorations in GA4 by clicking Explore (below Reports) in the leftmost nav, but this isn’t the best place to start if you’re an analytics beginner. Good news is that the Google documentation on Explorations is actually pretty clear and helpful.
There’s a wealth of GA4 information being shared
One great thing about GA4 shaking everything up is that there are so many helpful articles, videos and social media posts with tips and tricks. For example, I used UA for 6 years and never knew it had keyboard shortcuts, but I found out about them within a year of using GA4.
<div class="post-alert">Keyboard shortcuts aren’t available in Explorations, and not all of them are available in every part of GA4. Just type ? and it will bring up a menu showing which keyboard shortcuts are available based on where you are in GA4.</div>
Here are my favorites to use:
- s or / Search
- dx Set date comparison to year over year
- dc Set date range comparison to period over period
This list of ways GA4 is better than UA is far from complete. There’s a lot to learn, and GA4 is continually evolving as well. If you know of a noteworthy way GA4 is better than UA that I missed, I’d love to hear it! Also - if you're reading this prior to June 30, 2024 then you need a plan for exporting your historical UA data before it's deleted.
<div class="post-note-cute">This article was inspired by a question we got from a LinkedIn user after sharing one of Momentic’s GA4 guides - if you have questions about anything SEO or analytics-related, don’t hesitate to reach out: [email protected]</div>
Resources used to create this article
Here are the resources not already linked to within the article:
- [GA4] Summary card (Google documentation)
- [GA4] About overview reports (Google documentation)
- [GA4] Customize overview reports and “Reports snapshot” (Google documentation)
- [GA4] Customize report navigation (Google documentation)
- [GA4] Get started with explorations (Google documentation)
- [GA4] Keyboard shortcuts (Google documentation)
- [GA4] Analytics insights (Google documentation)
- Key Benefits of Using Google Analytics 4 (Optimize Smart)

