
Key points:
- UA had a built-in content drilldown report, but GA4 doesn’t have a direct equivalent
- There are different ways you can find the same kind of content drilldown data in GA4
- Each method has its pros and cons in terms of setup, lookback & shareability
What Is Content Drilldown?
Universal Analytics had a built-in Content Drilldown report that showed engagement metrics for page path levels so you could drill down from directories (folders) into subdirectories (subfolders) and individual pages.
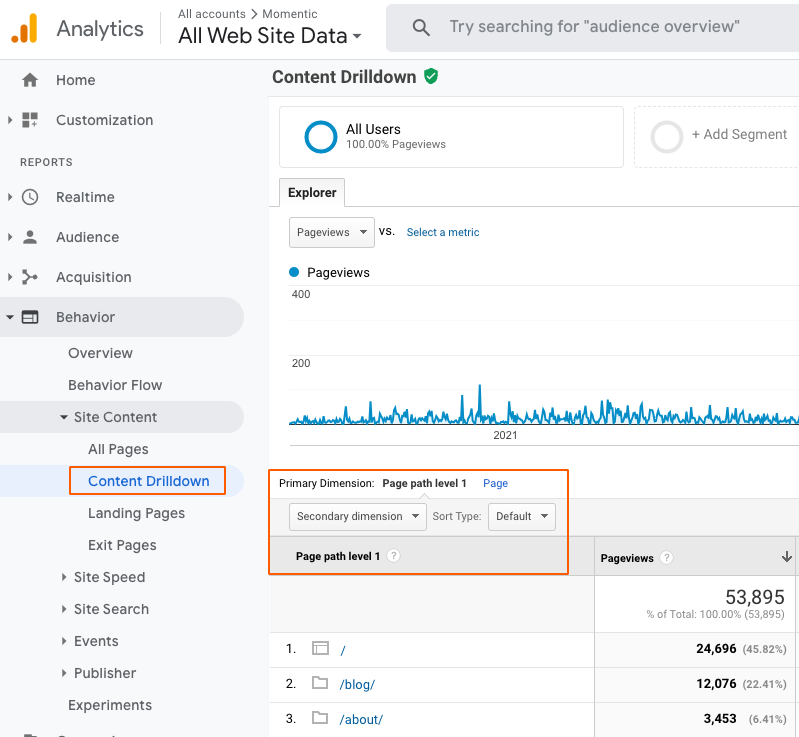
UA’s Content Drilldown report was a great shortcut for looking at content groups defined by directory. It could show you the topics or categories getting the most (or fewest) eyeballs, which is helpful for understanding what a specific audience is interested in, identifying content that could use a refresh, uncovering content with low visibility in the site navigation, and more.
Naturally people are looking for a similar content drilldown report in GA4, but unfortunately it doesn’t exist - at least not yet. GA4 is a work in progress, so they might add it down the road.
In the meantime, there are ways to access the same type of data in GA4 that you used to find in UA’s content drilldown report.
Search by Page Path in Standard GA4 Reports
If your URLs are organized into directories and subdirectories, you can enter the relevant part of of the URL in the search tool above the data table and it will just show you those URLs.
Example: Momentic’s website has a Team folder, and each team member’s page includes /team in the URL. By searching /team in the Pages and screens report, we can look at metrics just for those pages (the charts above the data table won’t change though).
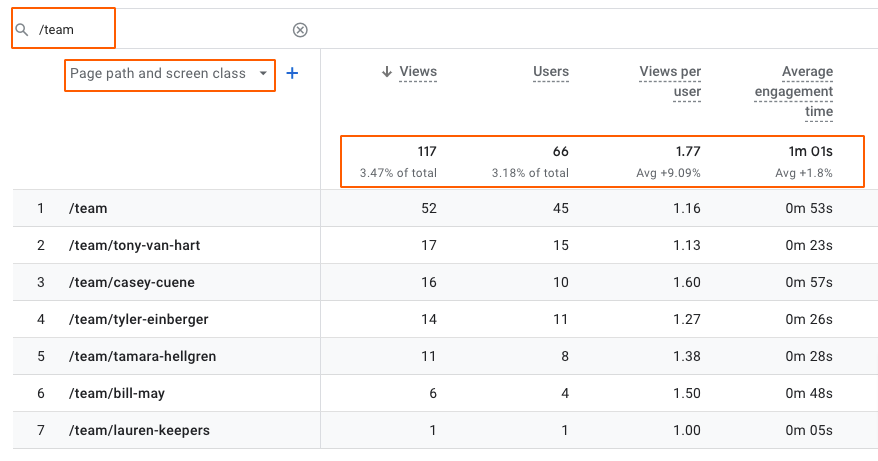
<div class="post-note">Select Page path and screen class from the dimension drop-down first (the default is Page title and screen name).</div>
You can also do this in the built-in GA4 Landing pages report.
Pros:
- Quick and easy
- You can see the total for all pages in the folder plus individual pages at the same time
Cons:
- You can’t see totals for different folders at the same time, like you could in UA’s Content Drilldown
- You have to select the page path dimension and type in the folder name every time
Customize Standard GA4 Reports
You can also drill down to URLs grouped by directory or subdirectory by adding a filter to the Pages and screens or Landing pages report. Start by selecting Page path and screen class from the dimension drop-down above the data table.
Next, add a filter:
<div class="post-action">Click the pencil icon</div>
<div class="post-action">Click Add filter</div>
<div class="post-action">In the Build filter panel that opens: Leave it set to Include (the default)</div>
<div class="post-action">Select Page path and screen class from the Select dimension dropdown</div>
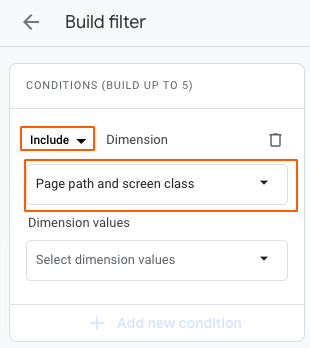
<div class="post-action">Select the URLs you want to include, using the dimension values dropdown. The URLs in this dropdown are in descending order by most views. </div>
<div class="post-action">Click Apply (bottom right)</div>
If this is a filtered view you’ll want to revisit, click the blue Save button, and save it as a new report. Then you’ll be able to access it in your report library (or add it into the left-hand navigation menu if you want).
<div class="post-alert">You can add the same filter to the report by clicking “Add filter” right below the report title, but then you won’t be able to save it.</div>
Pros:
- Filters the report charts as well as the data table
- You can save it as a new report and the filter will save too
- Lets you drill down to a specific set of pages even if they don’t share a common URL segment
Cons:
- Might be too time-consuming if you have a large website
- You have to create a filtered report for each directory you want to drill down into
Create Content Groups Based on Directories
We already have a whole guide to content grouping in GA4. Here’s how content groups can work as a stand-in for content drilldown in GA4.
Prerequisites:
- You need to have Administrator account permissions in Google Tag Manager
- Google Tag Manager needs to be installed on your website
Benefits:
- You only have to create the content groups once
- You can use the content groups in both standard reports and explorations
- Content groups let you compare how different directories are performing, just like in Page path level 1 of the UA Content Drilldown report
Once your content groups are established, you can select Content group from the dimension dropdown above the data table in the Pages and screens / Landing pages reports:
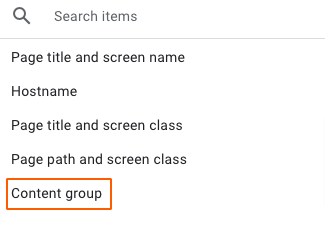
You can also use Content group as a dimension in Exploration reports:

Content groups that mirror your page path groupings can be used to analyze page performance at each path level, like you could in UA's Content Drilldown report.
Create an Exploration Report
You can also create an exploration report to drill down into content performance.
With content groups:
<div class="post-action">Start in Explore and choose Blank to create a new exploration.</div>

<div class="post-action">Under the Variables column, click the plus sign next to Dimensions and add Content group and Page path and screen class.</div>
<div class="post-action">Under the Variables column, click the plus sign next to Metrics and add the metrics you want to use to assess content performance.</div>
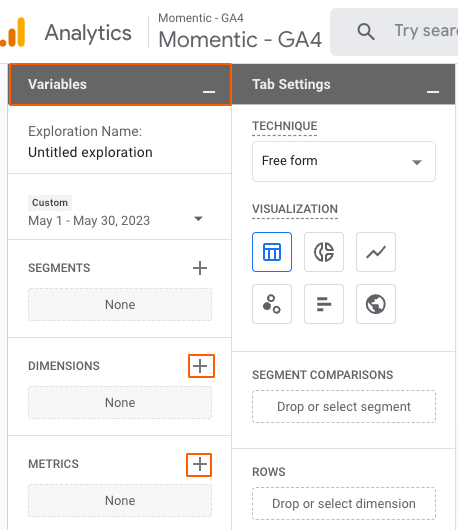
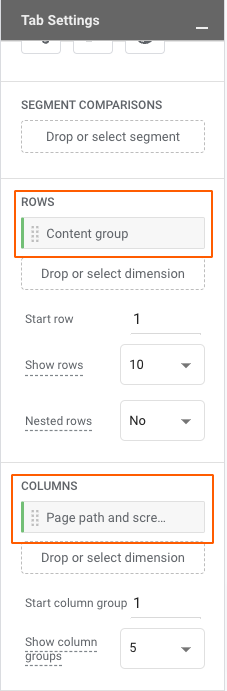
<div class="post-action">Drag and drop your dimension and metrics from the Variables column into the appropriate areas in the Tab Settings column.</div>
I suggest using Content group as the dimension under Rows, and Page path and screen class as the dimension under Columns. That way you can visualize group and individual URL performance at the same time:
Without content groups:
You can sill use explorations to drill down into folders and subfolders even if you haven't grouped your pages.
<div class="post-action">Drop the Page path and screen class dimension under Rows AND also under Filters.</div>
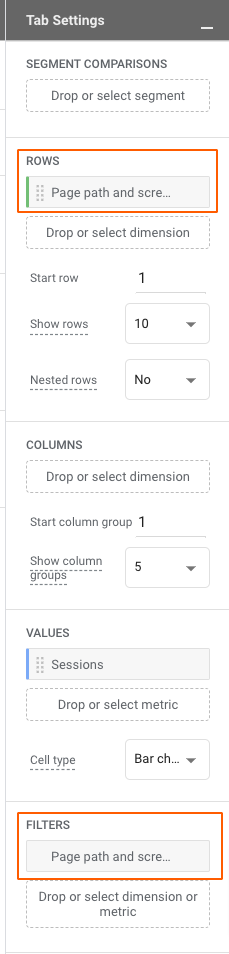
<div class="post-action">Click on the filter dropdown menu and choose how you want to filter your page paths.</div>
Fortunately there are plenty of filter options, including regex, so you can include or exclude exactly what you want.
The new exploration will save automatically. To make it easy to find, give it a name (top field in the Variables column).
Pros:
- You can use pages and/or content groups as dimensions
- You can save the exploration and come back to it
- You can customize the metrics, visualization type & filter
Cons:
- Data isn’t retained as long in explorations as it is in the standard reports
- Your exploration is only accessible to you unless you share it
- Shared explorations are in “view only” mode (not ideal for collaboration)
Of course there are many other ways to drill down into your GA4 data, but this article is focused on replicating the type of content drilldown reporting that was built into Universal Analytics. If you're looking for your most-used UA reports in GA4 it can feel frustrating, but there are actually several ways GA4 is better than UA, including the ability to create Explorations as described above, and the ability to customize or create brand new detail reports.
<div class="post-note-cute">If you need help with GA4, including reporting audits, dashboard configuration, or anything analytics related, don't hesitate to reach out: [email protected]</div>
this text

