In Universal Analytics you could click on any page in the data table to view a report for that individual URL. But in GA4 the pages in the data table aren’t clickable. So how can you drill down to track a specific page?
This article covers four different ways to see page views and other reporting metrics for a specific URL in GA4:
- Search by page path
- Add a page path filter
- Customize & save a detail report
- Create an Exploration
I'll show you exactly how, along with the pros and cons of each approach and how to see traffic sources to a single page. (We also have a guide to content drilldown in GA4, for drilling down into directories and subdirectories.)
1. Search by Page Path
You can search for a specific URL in the Pages and screens report and the Landing pages report. We’ll use the Pages and screens report as the example. In this report, the default dimension view is Page title and screen name, so our first step is changing that.
<div class="post-action">Start in the Pages and screens report. Click the dimension dropdown arrow and select Page path and screen class:</div>
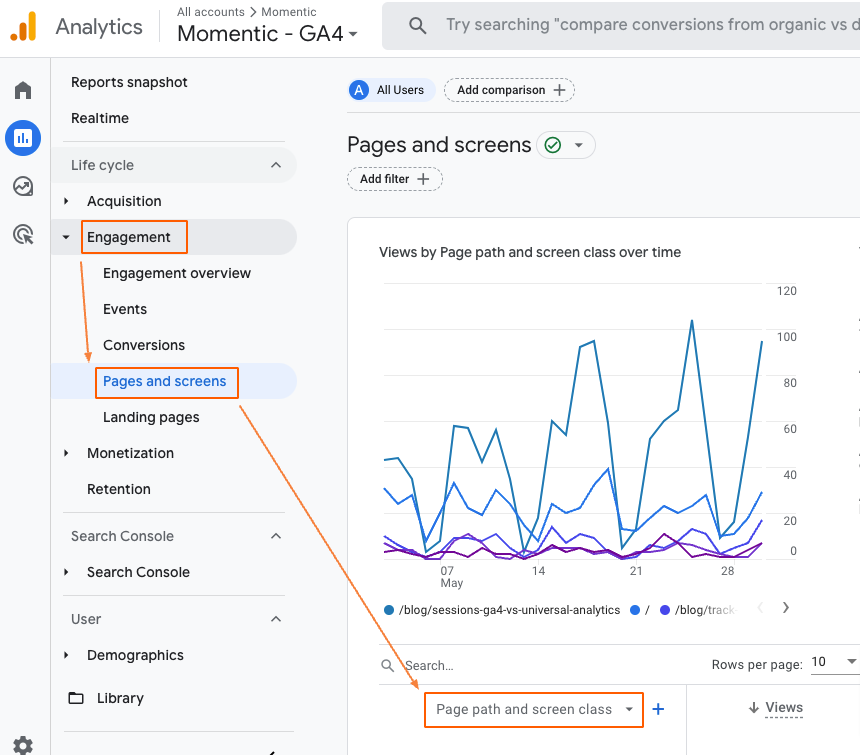
<div class="post-action">Click in the Search field above the dimension dropdown. Type in the page path for the URL you wish to analyze. Hit Enter on your keyboard.</div>
Page path is a better dimension than Page title in this case, because page titles can be updated. Depending on the report’s date range, it could list multiple page titles for the same URL.
Pros:
- Quick & easy
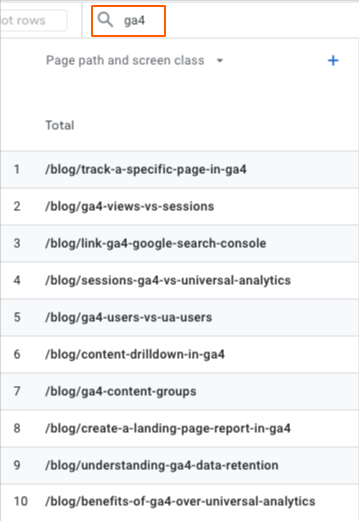
- You can also enter a specific word in the Search field to filter for all page paths that include that word (for example "ga4")
Cons:
- Only filters the data table, not the report charts above
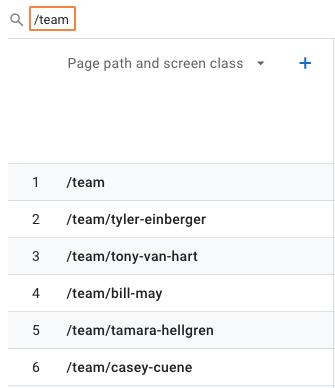
- Not helpful if you want to single out subfolder URLs, because it will include all the pages starting with the same page path. Example: Typing in “/team” includes all the pages with /team in the page path, so you can't see just the main team page on its own:
2. Add a Filter
You can also apply a report filter to view a single URL in the Pages and screens report and the Landing pages report. We’ll use the Pages and screens report as the example (it works the same way in both).
<div class="post-action">As shown above, click the dimension dropdown arrow and select Page path and screen class:</div>
Page path is a better dimension than page title when you're looking at a specific page, unless you're 100% certain the page title has never changed.
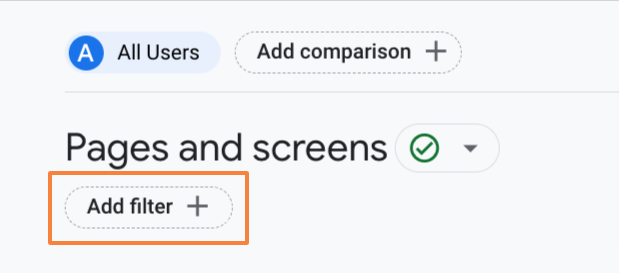
<div class="post-action">Click the Add filter button:</div>
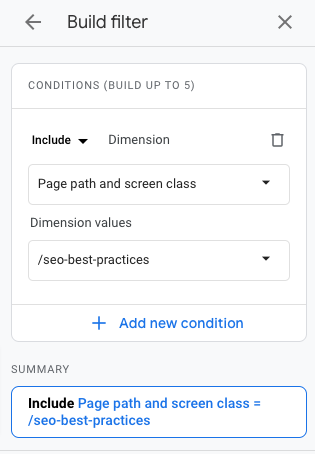
In the “Build filter” panel on the right:
- Select Page path and screen class as the dimension
- Select an individual page path from the Dimension values dropdown menu, then click OK
- Click Apply in the bottom right corner when finished
Pros:
- Filters both the data table & the report charts for an individual page path
Cons:
- You have to create a filter every time you want to drill down to a specific page - the next two methods are more efficient if you're going to repeatedly check traffic or page views to a certain page.
3. Create a Custom Report
If there’s a specific page you want to track in Google Analytics 4 over time, you can make a custom report for it.
<div class="post-note">You need to have Editor or Administrator level permissions to customize detail reports in GA4.</div>
There are two ways to customize a built-in GA4 report and save it as a new report.
Option one:
Library > Reports
<div class="post-action">Click on the three dots on the right-hand side of the report you want to customize. Click Make a copy.</div>

Give your new report a name (description optional) and click Save.
<div class="post-action">Open the report you just made, and click the pencil icon <span class="material-symbols-outlined">edit</span>in the upper right.</div>
<div class="post-action">Click Add filter inside the Customize report panel. Follow the steps described in the previous section to filter for the page you want to analyze.</div>
<div class="post-action">Click Save and select ‘Save changes to current report’</div>
Now you have a GA4 report that can track a specific URL, ready to go. You can access this new report under Reports > Library.
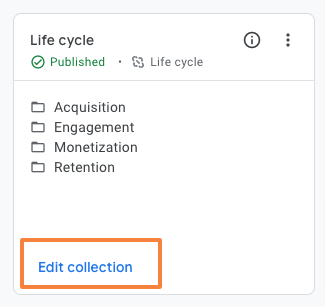
You can also add your new custom report to the GA4 side navigation by clicking ‘Edit collection’ under one of your published report collections. Then drag your custom report into the collection where you want it to live.
Pros:
- One-time setup for fast access to specific page metrics going forward
Cons:
- Only available for users with Editor or Administrator level access
- Only you can see custom reports you make. If you want other GA4 users to see them, you have to share them first. Open the custom report and click the ‘share’ icon in the top right:

4. Create an Exploration
Creating an exploration is a little more work than customizing one of the built-in Detail reports, but it’s less work than searching by page path or creating a filter every time you want to track a specific page.
Exploration from a Detail Report
To create an Exploration for a specific page from a detail report, start by adding a filter for the URL you want to focus on (as shown in section two, above).
<div class="post-action">Then click the “Export” icon in the upper right:</div>
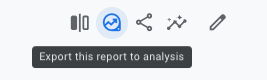
GA4 creates an Exploration based on the filtered detail report and takes you straight to it. It saves automatically, and you can find it under Explore from the left-hand nav.
The default name will match the name of the Detail report (e.g. Pages and screens) so you might want to make it more descriptive.
By default, only you (or the GA4 login you’re using) can see the Exploration you just made.
<div class="post-action">To share, click the share icon in the upper right inside an Exploration:</div>

<div class="post-action">Or click the three dots next to the report in your Explorations home page to share, duplicate or rename:</div>

<div class="post-note-cute">If you want to create multiple explorations to track several different individual pages, you can duplicate the first one and just update the page path filter.</div>
Exploration from Scratch
Option two: start from a blank slate in Explorations. It's a slightly longer setup but it’s a little cleaner—you can include only the metrics and visualizations you want, instead of carrying over everything from the detail report.
Creating an Exploration from a detail report will give you multiple tabs - one each for the two charts and table in the detail report - and prepopulates the metrics in the Variables section. (Then again it’s not much work to remove whatever you don’t want, and probably still faster.)
But for whatever reason if you prefer creating your own Exploration to see traffic to a specific URL, here’s how:
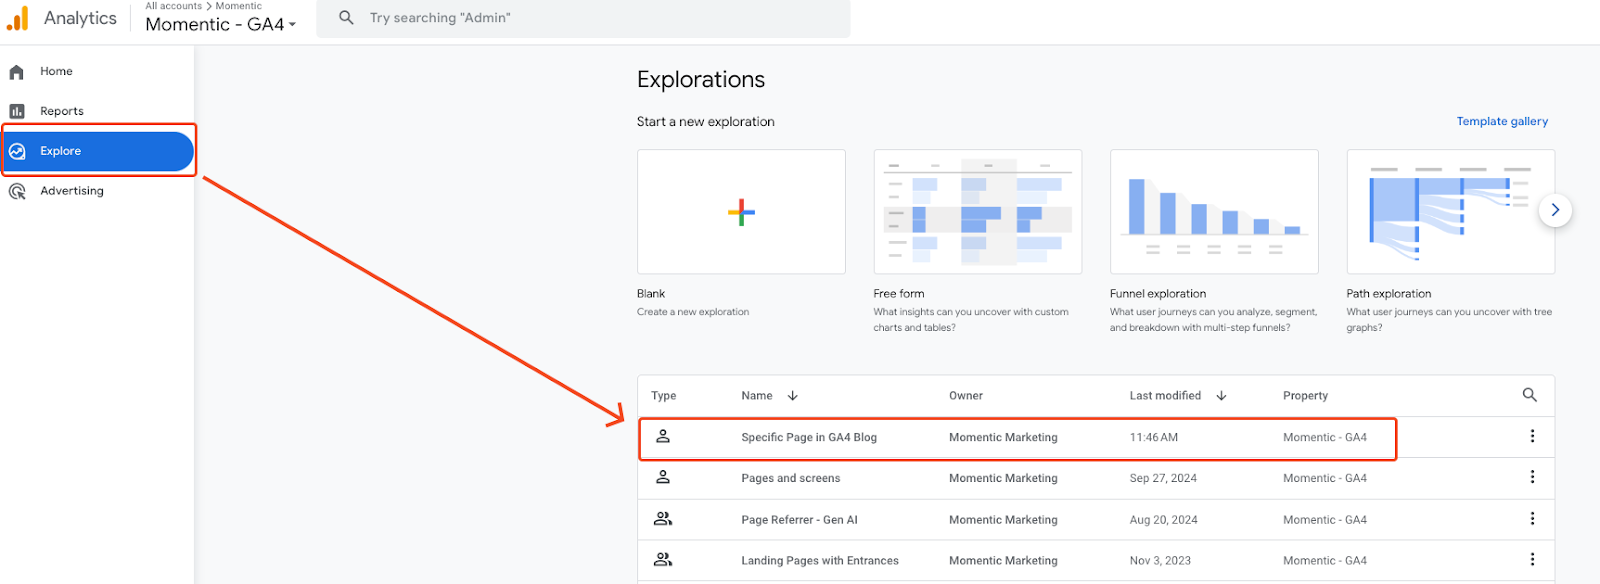
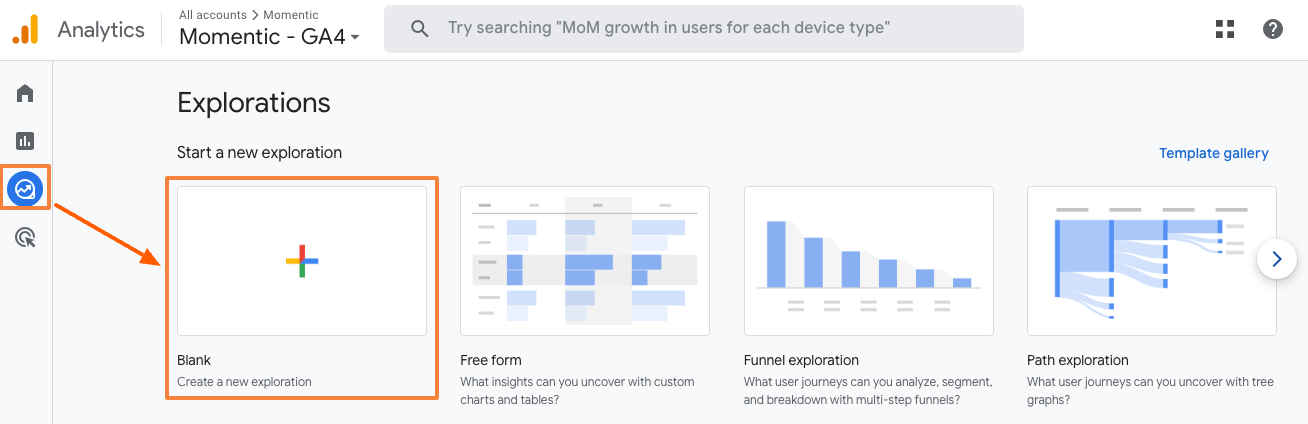
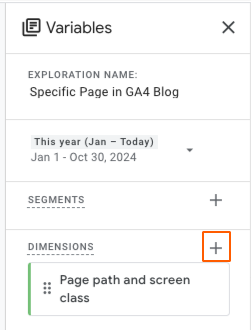
<div class="post-action">Click Explore in the left-hand navigation, then click Blank to start a new exploration:</div>
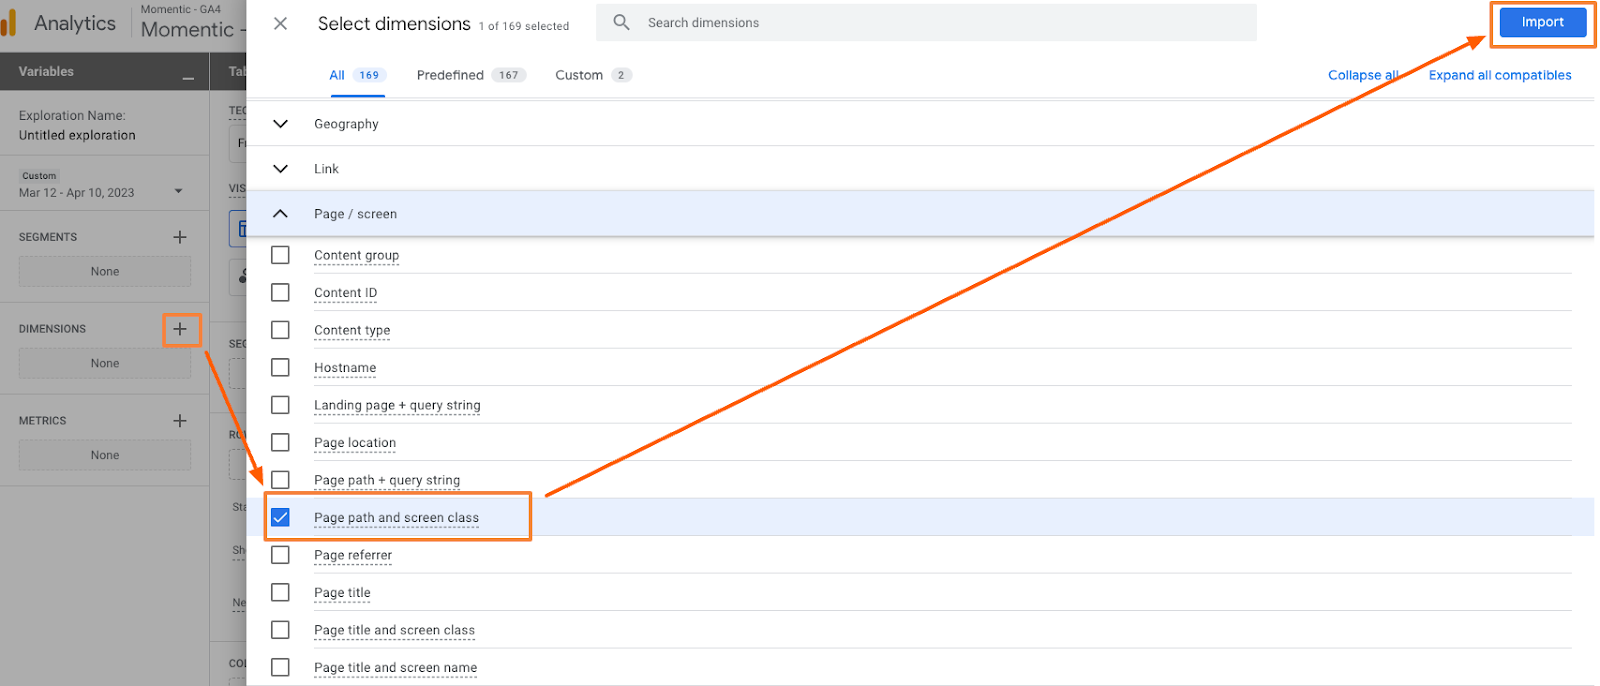
<div class="post-action">Click the plus sign next to Dimensions. Select ‘Page path + screen class’ from the dimensions menu. Click Import.</div>
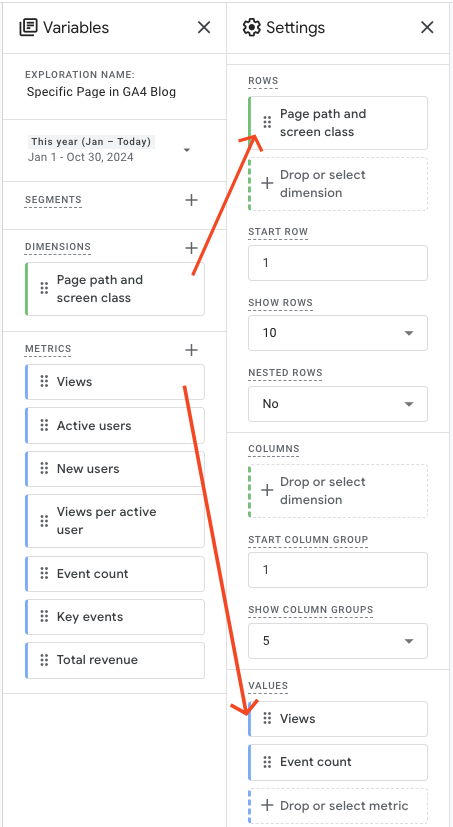
<div class="post-action">Click the plus sign next to Metrics. Select the metrics you want to track. Click Import.</div>
Next, you need to choose a Visualization format for your Exploration (default is table). The format you choose will change the options below. If you’re not sure which one to choose, just stick with table for starters. You can always change it later.

<div class="post-action">After choosing a Visualization, drag or double-click your dimensions and metrics from the Variables section to the Settings section.</div>
Next, we need to add a filter for a specific page path.
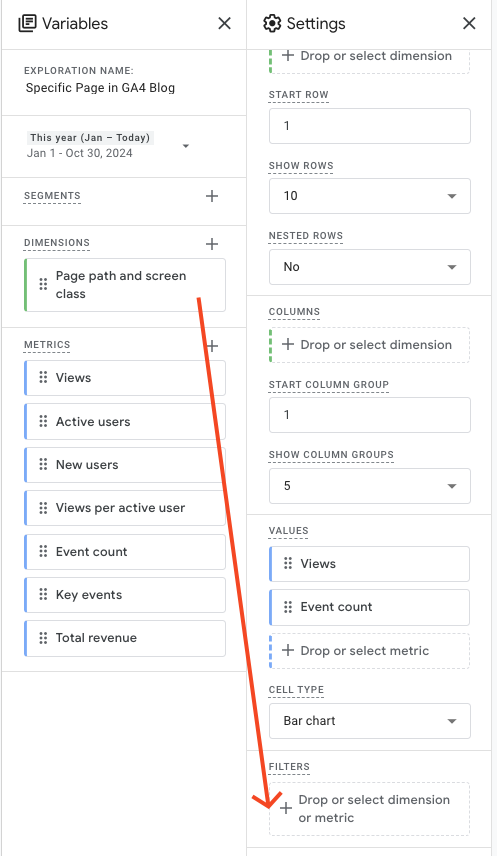
<div class="post-action">In the Settings column, scroll down to Filters. Drag and drop your Page path and screen class dimension into the filter:</div>
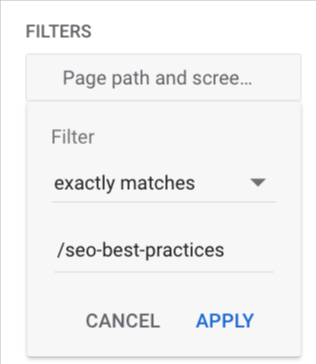
<div class="post-action">Select exactly matches from the filter menu. In the ‘Enter expression’ field, enter the page path you want to analyze (once you start typing it will give you options to pick from). Click Apply.</div>
Your Exploration report on the right should now only display data for the specific URL you entered.
Give your Exploration a name. No need to save. Any changes you make to your Exploration save automatically.
Pros:
- One-time setup gives you quick access to specific page metrics going forward
- More visualization & technique options compared to modifying an existing report
Cons:
- Takes more time compared to customizing a built-in report
- Only you can see the Explorations you create. If you want users with other Google Analytics logins to be able to see them, you’ll have to share them first.
Find Traffic Sources for a Specific Page in GA4
Once you’ve zeroed in on a specific URL using one of the methods above, it’s easy to see where traffic to that page is coming from.
Traffic Sources in a Detail Report:
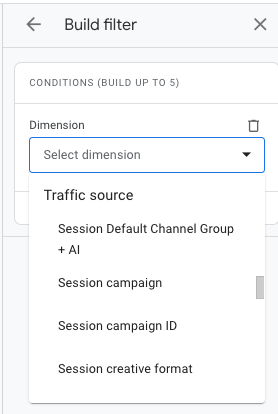
<div class="post-action">Click Add filter below the report name. In the Build filter panel on the right, search for (or scroll to select) your desired traffic source dimension from the dropdown menu - there are lots to pick from:</div>
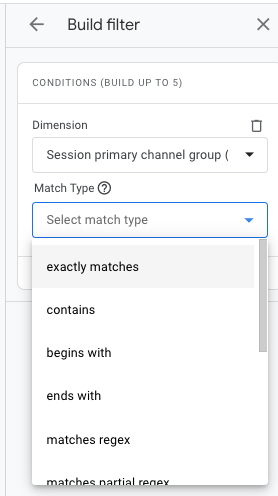
<div class="post-action">Select match type from the next dropdown menu that appears:</div>
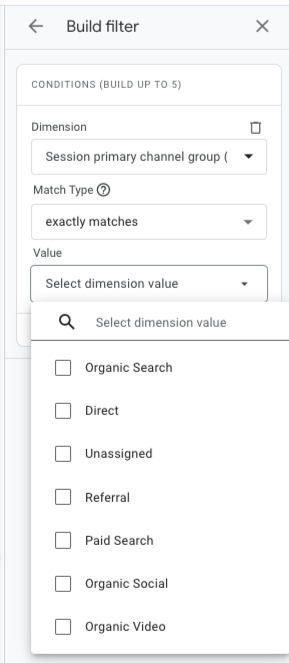
<div class="post-action">Then select one or more values (or enter your regex if that’s what you picked):</div>
<div class="post-action">Click Apply in the bottom right corner.</div>
Now your Detail report is filtered for the traffic source(s) you chose. Helpful if you just want to look at metric totals for one or more traffic sources, but not helpful if you want to compare different traffic sources. For that, use an exploration.
Traffic sources in an Exploration:
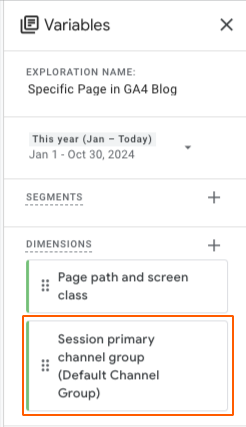
<div class="post-action">Click the plus sign next to Dimensions in the Variables section:</div>
<div class="post-action">Open up the Traffic source accordion to select an option, or search for it:</div>

<div class="post-action">Pick one or more, then click Confirm in the upper right corner.</div>
Now your traffic source dimension appears in the Variables section, but it’s not applied yet.
<div class="post-action">Double click it, and it will pop into the Settings section and also your visualization.</div>
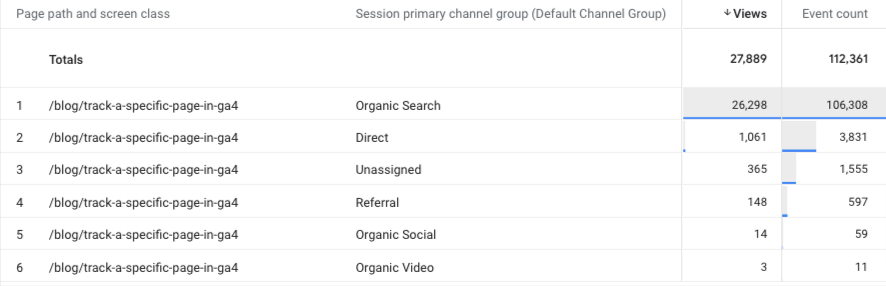
Voilà! Now you can see and compare traffic sources for a single page:
Checking Blog Traffic in GA4
Hopefully your blog URLs live in a single subfolder such as /blog. If so, it’s easy to see traffic sources, page views and other metrics for all your blog pages at once.
<div class="post-action">Create an Exploration with Page path and screen class as one of the dimensions (or duplicate an existing Exploration).</div>
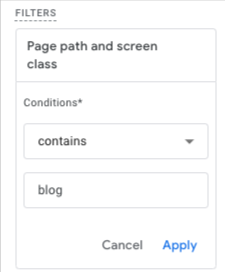
<div class="post-action">Add or edit the filter in the Settings section so the page path contains the first path segment (the word(s) in your blog subfolder), then click Apply.</div>
Next you can apply the traffic source dimension(s) of your choice, as well as any other dimensions, metrics or segments you want to see.
If your blog pages aren’t organized under one subfolder, you’ll need to drill down and/or create a content group to analyze them together.
Summary
GA4 is continually evolving, so someday maybe we’ll be able to click on page paths in the built-in reports. That would definitely make things easier!
You can also adapt these techniques to track a GA4 content group, or track multiple URLs that aren’t part of a content group.
<div class="post-note-cute">If you need help with GA4 implementation, reporting audits, dashboard configuration, or if you have questions about anything analytics related, don't hesitate to reach out: [email protected]</div>
Resources used to create this article:
https://support.google.com/analytics/answer/12931766?hl=en
https://support.google.com/analytics/answer/12926732?hl=en
https://support.google.com/analytics/answer/9305587?hl=en

